First draft

The following is a storyboard/outline for my animation. I initially planned to target an “interested” audience (e.g. the oyster industry and policymakers). However, as I was writing the storyboard, I started to realize what an entertaining format this is, and a more targeted message might seem awkward. As a result, I decided to keep the message as simple as possible, for as general an audience as possible.

I tried to write the story as a narrative, with oysters being potential “pollution fighters,” and the story revealing how effective they actually are. While I don’t get into specific numbers, I’ll show qualitative amounts via a bar graph, and reduced algae in the animation. One of my most important findings of my research is that reactive nitrogen (N) return to the water column is a significant process that can potentially counteract N extraction. While I could have used this as the moral of my story, I found it difficult to have this potentially disappointing finding be the climax of the story. So I focused on the good news (total extraction) as the main result, and include the reactive N as a link to “more research needed.”

MAIN POINTS AUDIO MEDIA
Opening credits   ·   “Oysters – Nature’s pollution fighters?”
Background Nutrient pollution in coastal waters is a serious issue that causes all kinds of environmental problems. When nutrients, for example N from fertilizer runoff, enter waterways, they cause algae to grow out of control, which can smother coastal grasses and kill fish. ·   N flows into water

·   Algae grows, water becomes dark, fish die

Problem We know that bivalves like oysters filter a lot of algae out of the water, but what about N? Can oysters be used to remove N, and help clean up nutrient pollution in coastal waters? ·   Oysters filtering, and water getting cleaner
Explain mechanism When oysters eat algae, some of the N in that algae is assimilated into the oyster’s tissues. When farmed oysters are harvested, this assimilated N is pulled out of the water (1). This removal of N by harvest is good for water quality!

However, most of the N that oysters eat is not assimilated. It’s actually spit out and ends up on the sediment. What happens to this N? The fate of this N is also important to water quality. The deposited N can stay put, and be buried (2), which also removes N from the water. Alternatively, it can be transformed by microbes to other forms of N that return to the water column.

One such process, called denitrification, produces N gas, a form of N that most algae can’t use. This gas will eventually diffuse out of the water, removing N, and helping water quality (3).

·   Oysters suck in algae-N and grow. Point to the oyster for assimilation (Arrow 1: “Harvest”).


·   Oyster spits out brown-N to sediment

·   Point to burial (Arrow 2: “Burial”)


·   Blue-N bubbles rise from sediment

·   Point to denitrification (Arrow 3: “Denitrification”)


Explain results So how much N can these processes actually remove? We measured these at an oyster farm in VA, and found that harvest removed the most N, and that burial may also be significant. Denitrification, however, was limited and only removed a very small amount of N.

Even though denitrification was limited, harvest and burial alone could remove much of the N entering the water around the farm. So oysters can be effective pollution cleaners. That’s great news for water quality!

·   Show bar graph, with oysters, brown-N, and blue-N piling up (to represent each pathway).

·   Maybe show arrows pointing to each pile again?


·   Maybe show algae flowing into bar graph (left to right), and less algae flowing out the right side.


Link to future research However, oysters aren’t perfect. Other microbial processes in the sediment under oysters produce forms of N that algae like to use. These forms, which we call reactive N, can be used by algae over and over again, potentially counteracting the benefits of the removed N.

At our farm, this return of reactive N to the water was big…really big…even larger than harvest. Does this reactive N ultimately counteract the benefits of the N removal? We’re still not sure. That likely depends on location, and we need to research this more in future studies.

·   Red-N bubbles rise from sediment and build up on bar graph

·   Point to reactive N (Arrow 4: “Reactive N (Nutrient pollution)”)

·   Algae re-appear with red-N


·   Bar graph washes away


Conclusion (still deciding whether or not I need one, or just end with the text above.)
Acknowledgements Created by: Abby Lunstrum

Music by: (probably my friend)

Funded by: VASG

·   Blank screen with text.


First Draft: Legislative brief and life cycle infographic

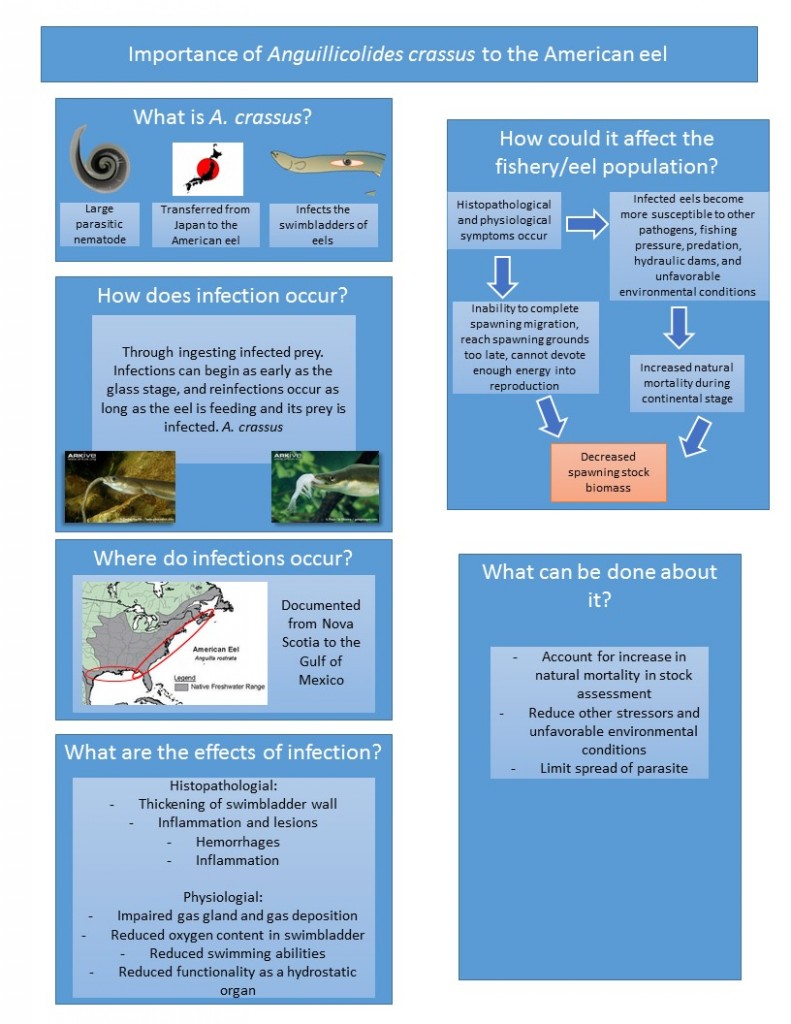
For my project, I’ve chosen to create two visuals that serve two purposes, but can be used in conjunction. The first is a one page handout explaining the background and importance of considering the nematode parasite in American eel management. This will be given to the board members of the Atlantic States Marine Fisheries Commission who make the management decisions. I want this handout to make them aware of the issue so that they are more open to accepting changes relating to it. In talking with the ASMFC coordinator for the eel group, he recommended making it very visual and graphics heavy because the legislators are used to getting text heavy documents, so this would be something different and hopefully more appealing. I still have a lot to do on how best to get my points across and how to best use visuals, but this shows a draft of the layout and information I would like it to include. I will probably end up deleting a lot of this text and replacing it with pictures. I will send this to the coordinator and other people at ASMFC to get feedback.

communications_first draft

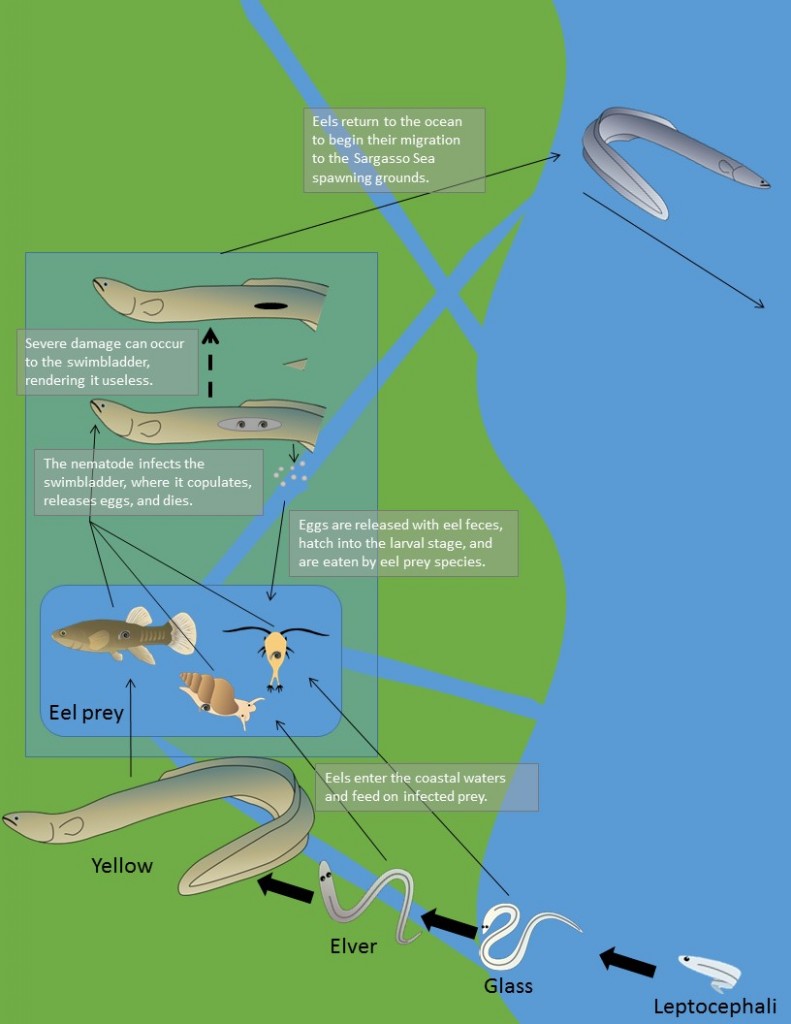
The second visual is the life cycle info-graphic, which I want to use to integrate the life cycle of the eel and the nematode so people can better understand how they go together. I plan to send this to the board members in addition to the handout, but I also plan to use it for presentations to a broad range of audiences. I want it to be visually appealing and easily understood so that people can understand it without me explaining it to them.

communications_first draft_lifecycle

I will need feedback on both about what is not easily understood and how to get rid of text and add more pictures.

First Draft

For my project, I ended up deciding to create two infographics, each of which are separately described below:

1) The aim of my first infographic is to present general information to the public/local community about the issue of stranded turtles in the Bay. My main points I wanted to get across is what strandings are and the fact that it is a local issue that happens right here in Chesapeake Bay. I also wanted to inform the audience what they should do if they find a stranded turtle (call it in to the stranding center). I also briefly mentioned some current efforts that are underway to study these events, including the stranding center and my research at VIMS. I thought this was a nice segway to lead into my second infographic.

Infographic 1: General information


2) The aim of my second infographic is to provide a little more information about efforts to study sea turtles strandings, specifically introducing my graduate research project. Specifically, i wanted to create a graphic to better explain the computer modeling aspects of my research methods. I want the audience of this infographic to still be the general public/local community, but target those who are a little more knowledgeable in the realm of science as it is a bit more advanced of a topic than the previous infographic. Some current challenges/questions I have with this product is whether or not the current introduction is necessary and if the text associated with the image is easy to understand. I was also struggling with a way to wrap up/conclude this infographic, so I currently placed a panel of global threats that sea turtles face on the bottom. I am not sure if this would be good to have, for if I include this I want to audience to be clear that these are global threats and not necessarily bay-specific threats since causes of mortality are mostly unknown in the Bay (hence, my research!)

Infographic 2: VIMS Research


For the VASG final symposium, I would like to present my product by turning my infographics into two posters. I would also like to have a few copies of my infographics in flyer form, so that I can distribute them as needed to interested personnel.

Project proposal

Nutrient pollution in Chesapeake Bay continues to be an environmental problem despite decades of effort to reduce nutrient inputs. “Nutrient bioextraction” using bivalve aquaculture has been proposed as a method for mitigating upstream pollution, especially for nitrogen (N). However, the total amount of N that can be removed, as well as potential negative environmental impacts, are still poorly quantified for oyster aquaculture. As a result uncertainties and debate remain about the effectiveness of using oysters for nutrient bioextraction. To help resolve this debate, my MS research quantified N bioextraction, as well as processes that returned N to the water column, at a commercial oyster farm in Chesapeake Bay. My communication project aims to present my conclusions in an engaging way using stop-motion photography animation.

I plan to target two specific stakeholder groups with this project: 1) policymakers and scientists involved in aquaculture and/or coastal water quality; and 2) people involved in the bivalve aquaculture industry.  The latter group—the aquaculture industry at large—may be relatively less informed about the nutrient bioextraction debate, and the science behind nutrient pollution in general. Thus, for this group, my animation will need to clearly explain the concepts of a) nutrient pollution and b) nutrient bioextraction. I expect relevant policymakers and scientists are already knowledgeable about these concepts, but would be interested in learning about my research results pertaining to the effectiveness of oyster aquaculture for nutrient bioextraction. Thus, for this group, my animation will need to clearly present quantified results, using language and depth of explanation appropriate for scientists and policymakers. To actively engage both groups, my animation will thus need to clearly explain: a) what is eutrophication; b) what is nutrient bioextraction; and c) how effective was the farm I studied at extracting nutrients.

The animation will be 1-2 minutes, and will be created using paper cut outs, photographed with a digital SLR camera, and produced (with sound) in iMovie or a similar program.  Examples of this animation method can be found at creaturecast.org, which hosts animations of ecological concepts made primarily by students at Brown University. Once it is produced, I will disseminate the animation by showing it at live presentations including the VA Sea Grant annual symposium and a NOAA brown bag lunch, which I am planning to give in spring 2016 with the help of my mentor, who is a NOAA scientist. I will also post the animation online (e.g., on my personal website), and will advertise the link in appropriate venues, possibly including the University of Virginia Department of Environmental Sciences homepage, the VA Sea Grant webpage, and industry webpages. Putting the animation on the internet will communicate the issue to an even wider audience. Although the main theme of the animation is nutrient bioextraction, the story reinforces understanding of nutrient pollution, which is still poorly understood by the general public. Oysters are an increasingly trendy food, and the public is eager to learn more about them, so an animation about oyster aquaculture specifically is a good vehicle to deliver this message.


Project Proposal: American eels and their nasty parasites

Marine parasites and diseases are seldom considered in fisheries management despite their potential for impact on a population. One such fish population that may have problems with parasites it the American eel (Anguilla rostrata). These snake-like fish are an economically and ecologically important fish species that has been in decline for the past decades. Currently their population is considered depleted and at historically low levels due to a combination of loss and alteration of habitat, dams, pollution, predation, and parasitism. In the mid-1990’s an invasive parasitic nematode Anguillicoloides crassus was discovered in an eel aquaculture facility in Texas as well as one river in South Carolina. Since then, it has rapidly spread throughout the range of American eel, and now can be found from Nova Scotia into the Gulf of Mexico. This parasite infects the swimbladder of eels, where it grows and develops while feeding on an eel’s blood. Repeated infections can cause severe damage to this important organ such that it is no longer able to function. My master’s thesis is investigating if this parasite is contributing to the depleted status of American eel through morbidity or morality effects. The information from my project will inform fisheries management on a potential source of natural mortality, which can then be used in stock assessments to better estimate the size of the population as well as population dynamics.

I have three possible ideas for communication projects based on a last minute conversation with my outreach mentor who is the American eel Coordinator for the Atlantic States Marine Fisheries Commission (ASMFC). One involves ASMFC board members and the other would target a more general audience that is initially interested in the American eel, so I’ll briefly describe both stakeholder groups. The ASMFC is the management agency for coastal fishes along the Atlantic coast of the U.S. The management decisions are made by a group of commissioners that represent the 15 member states as well as DC, Potomac River Fisheries Commission, National Marine Fisheries Service, US Fish and Wildlife Service. Each group has three representatives: an administrator, governor’s appointee, and legislator. For each species managed, there is a specific board made up of the groups that have a stake in that fishery. Therefore my project would target the American eel Management Board members (which should be all groups).The commissioners are very formal and legislative, so I would have to tailor my project to that style. For the general public interested in American eels, I would expect them to be fishermen and local managers, as well as people interested in going to the aquarium.

My first project idea is either a memo or presentation to the ASMFC board members, which I understand are different, but my outreach mentor is checking what is feasible and appropriate. The memo would state the problem American eels are facing and the plan that the Technical Committee has to address it. The presentation would be more in depth and show results from my project. I am unsure of more details at this time because my mentor is finding out if this would be appropriate to do.

My second idea is to assist in the creation of exhibit information to be placed at aquariums. I don’t know too much about this project right now because my mentor mentioned it briefly and needs to follow up with the woman working on it to determine if I could help out. But I would image it would be creating an information plaque about the importance and effect of marine parasites and disease on fish populations and a little about my eels as an example.

My third idea, if both of these fall through, is to create a graphic linking the life cycle of the eel with the life cycle of the parasite. This would be very useful in presentations to all audiences as a simple and intuitive way for people to understand the processes occurring.