Semi-final Project: Phase 1

Ciao tutti!

Let’s kick this post off with a confession…this is not a final outreach product but the next step towards a Drone CitiSci collaboration with the USGS’s iCoast. Revisiting the project concerns from the rough draft, all categories were addressed (in my opinion) and potential solutions are discussed here. Karen Morgan is my main point of contact at USGS St. Petersburg, FL along with the web developer for iCoast, Robert Snell. Pre and post storm drone photos from citizens would be a valuable addition to the current database of iCoast, which traditionally is comprised of photos taken from airplanes by USGS scientists. Including citizen drone photos enable greater spatial and temporal coverage of our beaches before and after storms to assess damages and morphology changes rapidly and accurately. Phase 1 of this project was a proof of concept determining if drones could create photos consistent with iCoast imagery and how should citizens then collect these photos. Examples photos are given below from iCoast and my personal drone. They look comparable! USGS currently uses iCoast photos to document coastal storm damages to the beach and surrounding infrastructure. Future work involves measuring features such as the shoreline, berm, dune toe, and dune crest for use in risk probability models by USGS.

Drone Imagery Collection Guideline:

  1. Determine if wind conditions are safe when flying before and after storms
  2. Make sure all people and animals are at a safe distance
  3. Before flying, enable the following parameters

Choose one camera exposure setting and keep it for all images

Angle camera such that the shoreline, beach, dunes, and infrastructure (if any) are visible

  1. Launch drone
  2. Fly drone 50 to 60 meters from the shoreline
  3. Use manual or automated flight controls to fly the drone along the shoreline

Set speed to 4.0 m/s and camera to timed photos every 5 seconds

  1. Fly as much of the coast as you like!

**Screenshots of  instructions coming soon**

Examples:
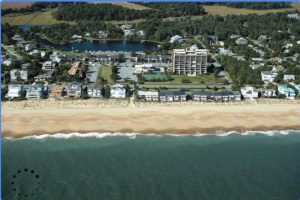
Top figure is from USGS iCoast and the bottom figure was taken by me using a DJI Mavic Pro

Photos Submission Process:

  1. Create an account on iCoast using a Google email (https://coastal.er.usgs.gov/icoast/)
  2. Submit photos after logging into account via the Submission box (to be created)

**Keep all exif (properties info) in photos**

  1. Photos will be quality checked then uploaded to iCoast for classification by fellow citizens!

Launch Events and Recognition:

To get the word out about this project, events will be held during VIMS’ Science Day and UD’s Coast day once the webpage is updated to accommodate this project. Special interest groups such as school STEM classes/clubs, retired and current pilots, Boys and Girls Clubs, Boy/Girl Scouts, and Citizen Science webpages/groups and USGS contacts will be approached for involvement. I foresee this being a mix of personal visits, skype meetings, and electronic advertisements.

Further down the road, I’d like to give recognition to citizens who submit their first photos. Perhaps a button, pin, or badge such as the Horseshoe Crab counting system employed in Delaware. Then, as more photos are submitted, that user is given recognition on the iCoast home page for the number of cumulative photos they’ve sent.

Drone CitiSci Project: Very VERY Rough Draft

Below is an outline type of table which I hope conveys my current mindset with respect to the drone citizen science project. My aim is to collaborate with the United States Geological Survey (USGS) by adding coastal images captured by recreational drone users before and after storms (potentially on a regular basis) to add to their existing iCoast CitiSci project. This open-source (html coded) internet project has been running for two years and encompasses the Mid-Atlantic states’ ocean coasts following several major storms such as Hurricanes Sandy and Joaquin. USGS Scientists captures oblique aerial images of the coast from a small plane before and after storms. Once images are uploaded to the website (https://coastal.er.usgs.gov/icoast/index.php), volunteer citizens login to categorize changes between the before and after images. These thousands of observations made by the citizens go into coastal morphological probability models to calculate the vulnerability of the photographed coastlines in the event of future storms.

I see a huge potential to increase both the spatial and temporal sampling of their image catch without additional funds and effort from USGS. I’ve never traveled to a place where someone isn’t fly a drone and taking photos or videos. There’s a huge opportunity to mine coastal images from recreational drone users while they enjoy flying their drones, taking great images, and improving their coasts’ resiliency to storm events. These are my thoughts as to what needs to be done for this project to proceed. Please let me know what you think!

Point/Task

Action

Questions and Issues

Collaborate with USGS

Make contact with manager of iCoast to discuss adding to the project My role in the altering of this project and if more funding is needed.

Example drone photos

Take images to demonstrate feasibility of drone images in the iCoast data collection method Will it be able to replicate the original plane images and provided the needed scientific data?

Method for adding drone photos

Determine if source code is currently compatible with drone images and metadata How is the photo metadata used by USGS? (Lat, Lon, altitude, camera parameters)

CitiSci photo collection guide

Create instructional video (drone perspective? Drone recording drone?) or ppt or instructional steps for volunteers What is the importance of the camera parameters such as resolution (MP) and focal length? Citi takes FAA responsibility for actions.

Submission of photos to USGS

Decide if link on iCoast webpage/login portal or email to contact for incorporation Identity concerns, amount of data anticipated, prioritize specific areas first?

Advertisement/Involvement

Get the word out and potential create workshops around the area to promote this and iCoast Webinar more effective?? Rather than traveling all the time, USGS has a broad audience to appeal to for this.


Product Proposal: “Data Collection Guide for Coastal Areas”

Overview

Coastal areas, ranging from densely populated cities to sandy beaches and tidal marshes, are valued spaces for many human, ecological, and environmental reasons alike. This creates high demand over a relatively small area where water meets land in an exciting, always-changing location. Along with the variety of uses, coastal areas are susceptible to damaging storms carrying strong winds, waves, and storm surges (increased water level). Coastal managers need high resolution maps of coastal areas to understand what assets are in these coastal areas, how they change during normal environmental conditions, storm conditions, and climate change. This enables the best management and policy decisions for all users of the coastal environment.

Unfortunately, high-resolution mapping for vegetation, infrastructure, beaches, and nearshore water depths traditionally required costly equipment such as airborne laser and survey vessels that are difficult to deploy rapidly due to size and personnel needed to operate the equipment. Improvements in instrument technology enables local managers, contractors, researchers, and monitors to map their sites with reliable, low-cost, high-resolution data. Consumer level drones map subaerial portions of the coast such as marsh, infrastructure (homes, jetties, seawalls, etc.), and beach surfaces through two-dimensional imagery which is stitched together into three-dimensional (latitude, longitude, elevation) maps using photogrammetry software. Bathymetric (water depth) data can be collected in shallow water using plastic or fiberglass remote-controlled vessels equipped with sonar systems to create two-dimensional sidescan sonar or three-dimensional bathymetry data. Sidescan sonar is useful in mapping benthic habitats such as oyster reefs and sediment type while bathymetric enables seafloor surface detection and sediment movement mapping.

Coastal data with sub-meter accuracy was traditional only available from survey companies with suites of sonar systems and survey vessels or through government agencies with airborne laser systems. Improved technology coupled with lower equipment and data processing costs has put high-resolution survey data into the hands of local municipalities. These groups would benefit from a single document demonstrating pros and cons for different platforms so they can make the most appropriate platform choice for their needs and resources using the experience of another user of these platforms rather than manufacturing stats alone which can be biased towards optimal performance by creator companies.

Audience

I wish to reach those pounding the ground, getting muddy, and collecting data or managing field operation teams. This would include groups in private contracting, governmental agencies, risk assessors, researchers, resiliency planners, and more.

Proposed Project

Coastal projects tend towards unique results with little overlap between sites. Thus the aim of this product is providing applicable methodologies and information for any coastal area around the world, not simply my study sites in Delaware. I envision a “Data Collection Guide for Coastal Areas” that encompasses my personal experiences in the field collecting data in marshes, beaches, and nearshore environments using a variety of instrumentation as well as my knowledge processing the data into usable products for monitoring and understanding environmental processes. The engineering community is fond of guidelines and guidebooks laden with graphs, decision trees, and equations; why not a background-friendly guide for managers, contractors, researchers, monitors who are looking to measure and understand their local coastal systems? The format is fluid at the moment but the document will be space and length efficient using images and tables to delineate what platforms are ideal for the type of coastal environment surveyed while incorporating available funds and personnel considerations.


Helpful Literature:

Casella, E., Rovere, A., Pedroncini, A., Stark, C.P., Casella, M., Ferrari, M. and Firpo, M., 2016. Drones as tools for monitoring beach topography changes in the Ligurian Sea (NW Mediterranean). Geo-Marine Letters36(2), pp.151-163.

Dohner, S.M., Trembanis, A.C. and Miller, D.C., 2016. A tale of three storms: Morphologic response of Broadkill Beach, Delaware, following Superstorm Sandy, Hurricane Joaquin, and Winter Storm Jonas. Shore & Beach84(4), p.3.

Drummond, C., Carley, J., Harrison, A., Brown, W. and Roberts, P., 2017. Observations from the design, construction and drone monitoring of a Geotextile sand container (GSC) seawall. Australasian Coasts & Ports 2017: Working with Nature, p.409.

Giordano, F., Mattei, G., Parente, C., Peluso, F. and Santamaria, R., 2015. Integrating sensors into a marine drone for bathymetric 3D surveys in shallow waters. Sensors16(1), p.41.

Kimball, P., Bailey, J., Das, S., Geyer, R., Harrison, T., Kunz, C., Manganini, K., Mankoff, K., Samuelson, K., Sayre-McCord, T. and Straneo, F., 2014, October. The whoi jetyak: An autonomous surface vehicle for oceanographic research in shallow or dangerous waters. In Autonomous Underwater Vehicles (AUV), 2014 IEEE/OES (pp. 1-7). IEEE.

Turner, I.L., Harley, M.D. and Drummond, C.D., 2016. UAVs for coastal surveying. Coastal Engineering114, pp.19-24.

Westoby, M.J., Brasington, J., Glasser, N.F., Hambrey, M.J. and Reynolds, J.M., 2012. ‘Structure-from-Motion’ photogrammetry: A low-cost, effective tool for geoscience applications. Geomorphology179, pp.300-314.