What the HAB is that? – Final Version

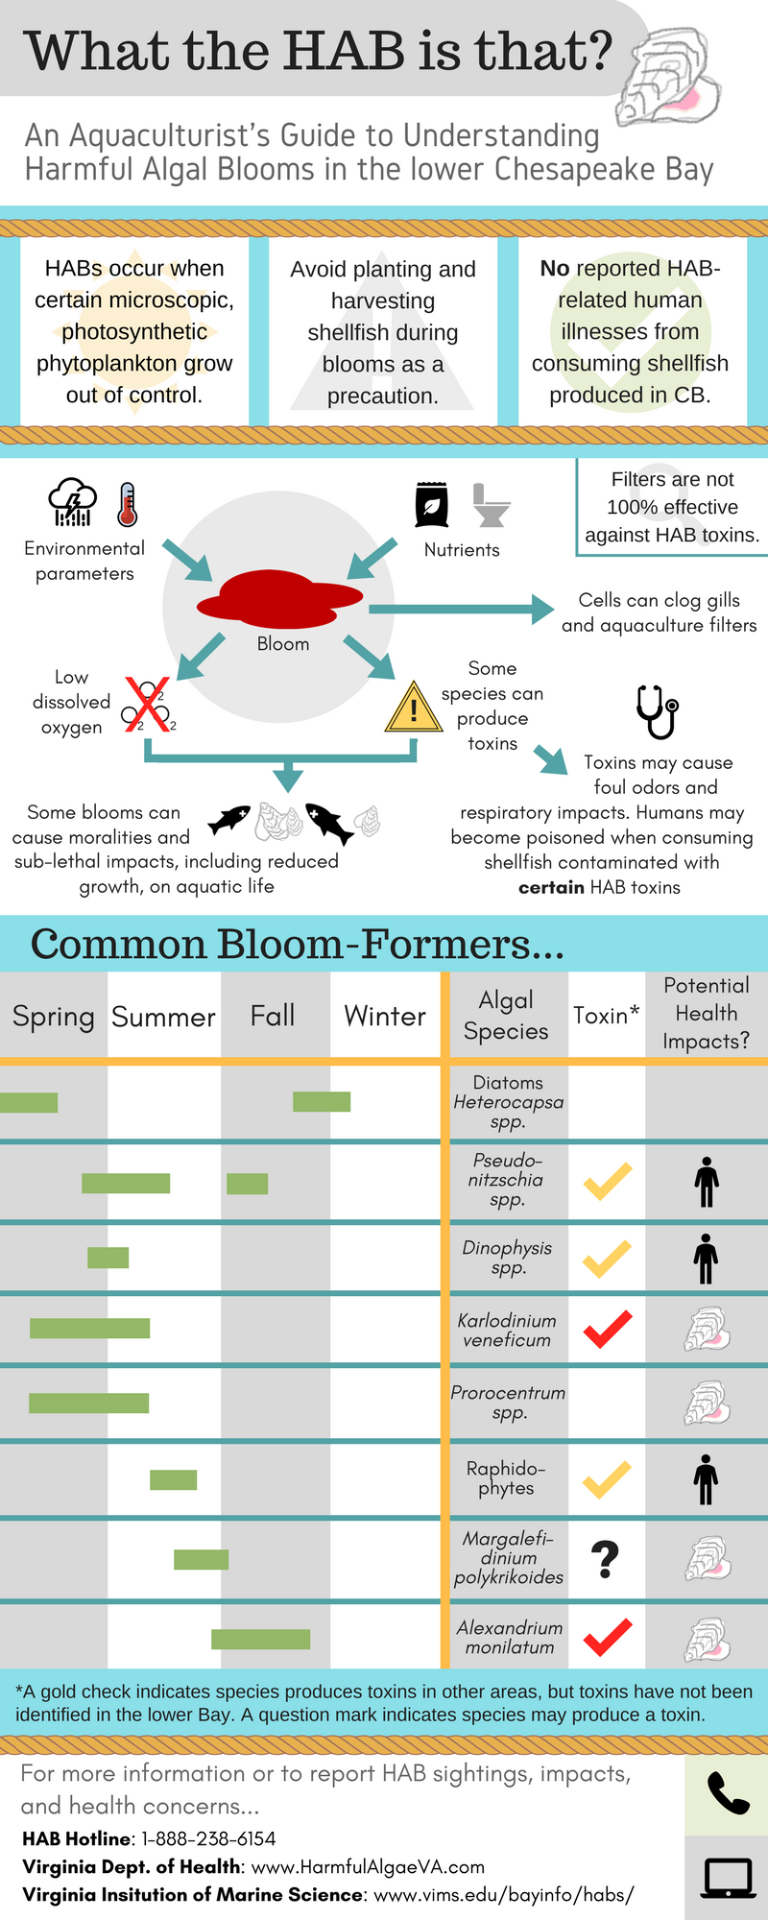
A Shellfish Aquaculturist’s Guide to Understanding/Identifying Harmful Algal Blooms in lower Chesapeake Bay

Audience: Local shellfish growers

Purpose: Understanding/identifying blooms that may be occurring in their area

Dissemination: So far, it will be posted on the VDH HAB Resources page, possibly the VIMS website, possibly the VMRC website, and I will personally distribute it to all the growers/industry members I work with


PDF of the Infographic (for electronic dissemination):

HAB Infographic-2ac3kw3


Word version of only the HAB ID table (for easy printing):

HAB Infographic printable-1p75trt


Outreach Product Draft Part 2

Urea Infographic

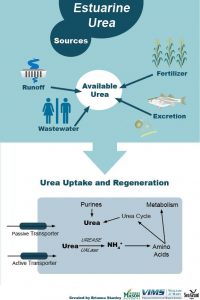
Two versions of this infographic illustrating the sources of the urea nutrient in the Chesapeake Bay were created: one to distribute at events and to use in non-scientific presentations and a second to use with a scientific audience. Both will be used teaching a wastewater course to educated individuals in the wastewater industry. For the final version the wastewater icon will be redrawn, as no directly applicable icon was found on IAN.

HAB Infographic ~ 1st Draft

What the HAB is that?

An Aquaculturist’s Guide to Understanding Harmful Algal Blooms in the lower Chesapeake Bay

~~~

Target Audience: Aquaculturists in the lower Bay.

Purpose: To provide information to local shellfish farmers about harmful algal blooms, their effects, and potential mitigation strategies. My outreach mentor, Tommy Leggett, is a local oyster and clam farmer, and he expressed interest in a quick and dirty resource for identifying whatever bloom might be hanging out over his oysters and whether he should be worried about it.

The Infographic: My primary focus points are accuracy and relevance to my target audience. In my limited space, I’ve tried to include some of the most important “fun” facts about blooms, information about common bloom-formers and their impacts, and resources growers can use to make reports and find additional information. Unfortunately, I didn’t have the time or technical skills to create all of the icons myself (I made the oyster:), and I may try to replace some of those pictured with designs of my own.

Additional Work: I am in the process of communicating with industry members and representatives, scientists, and VDH for feedback. I’m also still pondering the best way to distribute this graphic. When I have a closer-to-final draft, I plan to reach out to some industry groups and ask if I can use their communication resources (e.g. newsletters, websites, etc.)


Final Product: Fantastic Virginia Corals and Where to Find Them

I am really excited with how the final video turned out! Poor diving conditions prevented me from getting a lot of the extra video that I was hoping for, but I think I made good use of what I have. Taking into account the comments from our last meeting, I tried to create a story that introduces the viewer to a relatively unknown coral species and its importance to the coast of Virginia. It has been uploaded to the Virginia Sea Grant YouTube page, check it out here: https://youtu.be/ICCY8NtFVfk


Final Project – Functional Diversity Educational Activity

Functional Diversity Outreach Activity

Luke Bassett

1/4/2015


In order to help teach the public on the importance of teleost diversity and inform them of the various diversity indices used to study biodiversity, I plan on creating an interactive activity for Activity Days at the Virginia Institute of Marine Science and other local festivals. I plan to use laminated cards with common Chesapeake Bay teleosteans on the front side and details concerning their functional traits on the backside. My hope is that studying characters in actual fish will allow students to learn more about Chesapeake Bay inhabitants. Prior to the beginning of the activity I will give a brief explanation of the importance of functional traits and functional diversity. For younger students, I will relate these traits to the food web to help flesh out a background understanding on the topic. An individual or group will be given a set of cards and will then be asked to divide the cards into three to six groups based on appearance and/or functional traits listed. The amount of groups will be decided upon the older students themselves. For younger students, I will choose a specific number to make the activity easier. Likely, I will have younger individuals categorize fish purely by their appearance while older groups will use feeding, form and locomotion, size, and distribution characteristics as well. I may also have one group/individual categorize the fish purely based off the characteristics written on the back of the card while the other group/individual will categorize them based off individuals. I will then have the participants explain to me their reasoning behind their chosen grouping. After listening to them argue their explanations, I will explain the logic behind functional ecological groups and how they are determined as well as the fact they just created their own functional groups, albeit, in a simplified manner.


Target Audience

            My target audience will range from late elementary school students and their families to high school students. Younger students will focus more heavily on categorizing the fish based by appearances rather than traits listed.


The Activity and Project are included in the link below. Tracked Changes, Markup, or Review may need to be turned off depending on your word processor.

Bassett_OutreachActivity

Functional Diversity Educational Activity

Functional Diversity Educational Activity

Luke Bassett

12/4/2015

(Complete Functional Diversity Activity included in attachment)

In order to help teach the public on the importance of teleost diversity and infrm them of the various diversity indices used to study biodiversity, I plan on creating an interactive activity for Activity Days at the Virginia Institute of Marine Science and other local festivals. Originally this activity was going to focus on creating a functional dendogram or phylogenetic tree using stuffed animals, but after meeting with Karen Akerlof, Kathy Rowan, and Janet Krenn, I decided instead to change the activity to one involving laminated cards as. Studying characters in actual fish will allow students to learn more about Chesapeake Bay inhabitants. An individual or group will be given a set of cards each with a different fish on the front and some characteristics and functional traits on the back. They will then be asked to divide the cards into three to six groups based on appearance and/or functional traits listed. Likely, I will have younger individuals categorize fish purely by their appearance while older groups will use feeding, form and locomotion, size, and distribution characteristics as well. I may also have one group/individual categorize the fish purely based off the characteristics written on the back of the card while the other group/individual will categorize them based off individuals. I will then have the participants explain to me their reasoning behind their chosen grouping. After listening to them argue their explanations, I will explain the logic behind functional ecological groups and how they are determined as well as the fact they just created their own functional groups, albeit, in a simplified manner. Depending on where I am in my research, I will also show them the functional dendrogram that I have created with the fish used in the game highlighted.

Target Audience

            My target audience will range from late elementary school students and their families to high school students. Younger students will focus more heavily on categorizing the fish based by appearances rather than traits listed.

Illustration Workflow

The process for creating an animation begins with organized idea that gets translated into a simple rough sketch before finalizing into a refined illustration.

1. Organize Your Idea

Before you start drawing, you want to make sure to think through your idea so you have a organized plan for what needs to be included and what the goal of the illustration is. To do this, write down answers the following questions:

  • What is the goal of completing this illustration?
  • Who is the audience?
  • What information needs to be included for the audience to care?
  • What information needs to be included for the audience to understand the illustration?

2. Create a Rough Sketch

Keeping your goal and audience in mind, draw a simple sketch. It can be as simple as boxes with words to show what icons or images should appear where. It can be something that looks more representational of what you think the final image should be. The key is to sketch in a format that’s quick and easy for you to use. The goal in this step of the process is to create a plan for the final image. So don’t use a illustration tool that you’re not familiar with at this time. Pen and paper is fine.

3. Draw the Final Illustration

Before you start drawing, consider whether you need to draw at all. There may be tools or clip art out there to help you simplify the process. Here are three options you can consider:

Use an Illustration Tool

When it comes to making an illustration Integration & Application Network at University of Maryland Center for Environmental Science (IAN) has a large library of stock images, icons, and symbols: http://ian.umces.edu/ There are several tools you can use that you can simply drag and drop icons to build your illustration. Infographic Apps could be useful to help you build an illustration.

Gather Clip Art and Do Your Own Layout

You can also consider editing clip art from a free or paid stock art service and arrange these pieces and add text in another program, such as MS Word, MS PowerPoint, Adobe InDesign, or another program. You can find images through stock and open source image services.

Drawing and Designing from Scratch

If you want to work from scratch, you could draw and design your illustration using professional software. To do this, you’ll need to know a little bit about layout and design, and you’ll need to identify an illustration tool you’d like to use. Adobe Illustrator is the leading vector illustration tool. Adobe Photoshop is really not designed for creating illustrations, but it can be paired with Illustrator to achieve some different effects. Here are some training videos through Lynda.com that might be useful, however, you will also find many more resources that tackle specific issues on YouTube.:

Animation and Video Production Overview

The process for animation and video begins well before you will start working with specialized software. Here are the production steps that professionals follow when making an animation or video:

  1. Pre-Production: In this phase, you outline your idea as a script and storyboard. These steps provide the road map. Here’s what you do:
    1. Write out an outline and script of what you want your project to be about.
    2. Convert your script or outline into a visual outline that shows that actions or visuals the viewer will see at each point of the outline. This is called a storyboard. You can use a template like this Storyboard Template and see more detailed instructions on storyboarding here.
  2. Production: Once you have your pre-production road map in place, you can start filming or animating. Here are some animation and video software that might be helpful.
  3. Post-Production: In this phase you incorporate audio, transitions, and fine-tune color issues. Then export your final project.