Product Proposal: “Data Collection Guide for Coastal Areas”

Overview

Coastal areas, ranging from densely populated cities to sandy beaches and tidal marshes, are valued spaces for many human, ecological, and environmental reasons alike. This creates high demand over a relatively small area where water meets land in an exciting, always-changing location. Along with the variety of uses, coastal areas are susceptible to damaging storms carrying strong winds, waves, and storm surges (increased water level). Coastal managers need high resolution maps of coastal areas to understand what assets are in these coastal areas, how they change during normal environmental conditions, storm conditions, and climate change. This enables the best management and policy decisions for all users of the coastal environment.

Unfortunately, high-resolution mapping for vegetation, infrastructure, beaches, and nearshore water depths traditionally required costly equipment such as airborne laser and survey vessels that are difficult to deploy rapidly due to size and personnel needed to operate the equipment. Improvements in instrument technology enables local managers, contractors, researchers, and monitors to map their sites with reliable, low-cost, high-resolution data. Consumer level drones map subaerial portions of the coast such as marsh, infrastructure (homes, jetties, seawalls, etc.), and beach surfaces through two-dimensional imagery which is stitched together into three-dimensional (latitude, longitude, elevation) maps using photogrammetry software. Bathymetric (water depth) data can be collected in shallow water using plastic or fiberglass remote-controlled vessels equipped with sonar systems to create two-dimensional sidescan sonar or three-dimensional bathymetry data. Sidescan sonar is useful in mapping benthic habitats such as oyster reefs and sediment type while bathymetric enables seafloor surface detection and sediment movement mapping.

Coastal data with sub-meter accuracy was traditional only available from survey companies with suites of sonar systems and survey vessels or through government agencies with airborne laser systems. Improved technology coupled with lower equipment and data processing costs has put high-resolution survey data into the hands of local municipalities. These groups would benefit from a single document demonstrating pros and cons for different platforms so they can make the most appropriate platform choice for their needs and resources using the experience of another user of these platforms rather than manufacturing stats alone which can be biased towards optimal performance by creator companies.

Audience

I wish to reach those pounding the ground, getting muddy, and collecting data or managing field operation teams. This would include groups in private contracting, governmental agencies, risk assessors, researchers, resiliency planners, and more.

Proposed Project

Coastal projects tend towards unique results with little overlap between sites. Thus the aim of this product is providing applicable methodologies and information for any coastal area around the world, not simply my study sites in Delaware. I envision a “Data Collection Guide for Coastal Areas” that encompasses my personal experiences in the field collecting data in marshes, beaches, and nearshore environments using a variety of instrumentation as well as my knowledge processing the data into usable products for monitoring and understanding environmental processes. The engineering community is fond of guidelines and guidebooks laden with graphs, decision trees, and equations; why not a background-friendly guide for managers, contractors, researchers, monitors who are looking to measure and understand their local coastal systems? The format is fluid at the moment but the document will be space and length efficient using images and tables to delineate what platforms are ideal for the type of coastal environment surveyed while incorporating available funds and personnel considerations.


Helpful Literature:

Casella, E., Rovere, A., Pedroncini, A., Stark, C.P., Casella, M., Ferrari, M. and Firpo, M., 2016. Drones as tools for monitoring beach topography changes in the Ligurian Sea (NW Mediterranean). Geo-Marine Letters36(2), pp.151-163.

Dohner, S.M., Trembanis, A.C. and Miller, D.C., 2016. A tale of three storms: Morphologic response of Broadkill Beach, Delaware, following Superstorm Sandy, Hurricane Joaquin, and Winter Storm Jonas. Shore & Beach84(4), p.3.

Drummond, C., Carley, J., Harrison, A., Brown, W. and Roberts, P., 2017. Observations from the design, construction and drone monitoring of a Geotextile sand container (GSC) seawall. Australasian Coasts & Ports 2017: Working with Nature, p.409.

Giordano, F., Mattei, G., Parente, C., Peluso, F. and Santamaria, R., 2015. Integrating sensors into a marine drone for bathymetric 3D surveys in shallow waters. Sensors16(1), p.41.

Kimball, P., Bailey, J., Das, S., Geyer, R., Harrison, T., Kunz, C., Manganini, K., Mankoff, K., Samuelson, K., Sayre-McCord, T. and Straneo, F., 2014, October. The whoi jetyak: An autonomous surface vehicle for oceanographic research in shallow or dangerous waters. In Autonomous Underwater Vehicles (AUV), 2014 IEEE/OES (pp. 1-7). IEEE.

Turner, I.L., Harley, M.D. and Drummond, C.D., 2016. UAVs for coastal surveying. Coastal Engineering114, pp.19-24.

Westoby, M.J., Brasington, J., Glasser, N.F., Hambrey, M.J. and Reynolds, J.M., 2012. ‘Structure-from-Motion’ photogrammetry: A low-cost, effective tool for geoscience applications. Geomorphology179, pp.300-314.

A (Brief) Guide to Navigating the Shoreline Permitting Process

Below is a proposal for my outreach product for the 2017 Advanced Science Communication Seminar. In brief, my goal is to design a visual aid for coastal landowners to guide them through the shoreline permitting process in the state of Virginia.

The product could then be distributed by my host office (Virginia Department of Conservation and Recreation’s Shoreline Erosion Advisory Service) during site visits to give coastal landowners an overview of the process from start (recognition of erosion problem) to finish (properly installed shoreline management structure).

Proposal:

Outreach_Proposal_Pfirrmann-18vee03

What Makes A Wetland A Wetland? – Draft 1

What Makes a Wetland a Wetland?

Project Update: During some informal conversations with friends and family, I realized there is much less understanding of what a wetland is than I had originally thought. So I decided  I would like to  focus my project  primarily on what exactly makes something a wetland (i.e., hydrology, soils, and plants). I have copied the first draft of my script below, and some draft sketches for the animation. I still need to work out a few kinks, and transitions between topics, but this draft covers the basic framework of what I would like my audience to learn.

I am still struggling with how to end the animation. First of all, it is entirely possible that this script is too long for a 2-3 minute video. Aside from that, I can’t decide what theme to end on.  I think it is really important to reinforce why wetlands are important – so that’s how I currently end my script. But I also really want to convey how changing climate affects wetland hydrology (not yet in the script). I don’t think I have enough time to cover both ecosystem functions and wetland vulnerability, so if I had to choose one, which should it be?

Script 1.0

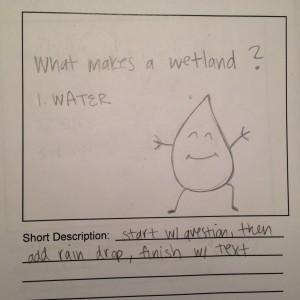
  • What makes a wetland a wetland? Well the simplest answer is water.
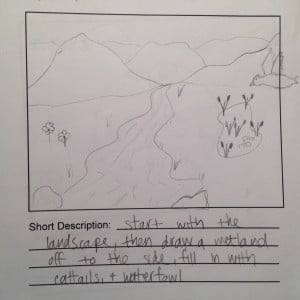
  • Wetlands are not completely dry, nor are they bodies of water such as a lake, pond, river, or stream. Wetlands are areas of land either permanently, or periodically saturated with water.
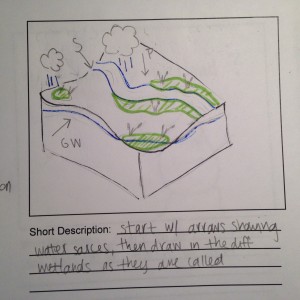
  • Sources of water to wetlands include precipitation, runoff, groundwater, and tides.
    • While many wetlands are found in transitional zones between upland and aquatic ecosystems, for example next to a river or lake,
    • Wetlands can also form anywhere on the landscape with an accumulation of water such as surface depressions that collect rainfall and runoff, or areas where groundwater discharges to the land surface
  • The development of characteristic wetland soils, and the growth of specially adapted wetland plants depends on the presence of water.
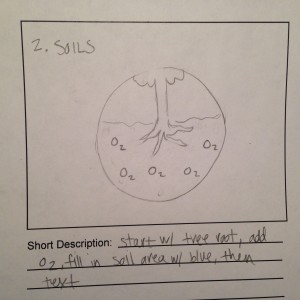
    • In most non-wetland soils, oxygen is readily available to plant roots and oil bacteria. However, in saturated soils water displaces oxygen, leading to anaerobic, or oxygen-limited conditions. These are called hydric soils
    • In fact, decomposition in anaerobic soils is what gives wetlands their characteristic rotten egg smell.
  • Plant species have varying tolerance of saturated soils.
    • Species such as cattails are almost always found in wetlands, while other species such as red maple are equally likely in wetland and upland habitats
    • Wetland plants, also known as hydrophytes, have evolved special adaptations that allow them to survive and grow in low-oxygen hydric soils.
  • Wetland water levels, or hydrology, can range from permanently to rarely flooded. Some wetlands may have a shallow layer of standing water, while others may be muddy, or even appear dry for much of the year. However, as long as saturated conditions persist long enough to develop hydric soils and support wetland plants, the area is considered a wetland.
    • There are many different types of wetlands depending on the hydrology – movement of water, soils, and plant species found there.
    • For example, marshes are permanently or temporarily flooded wetlands, often dominated emergency vegetations such as cattails or marsh cordgrass.
    • While swamps are forested areas dominated by woody vegetation such as bald cypress and tupelo trees, and subject to seasonal patterns of inundation.
  • Although once viewed as stinky, insect-ridden wastelands, we now know that wetlands perform many important ecosystem functions.
    • Wetlands act as a natural filter to improve water quality. Often described as nature’s kidney’s, wetlands remove excess nutrients, sediment, and pollutants from our waterways, just like kidney’s filter toxins from our blood
    • Wetlands also provide protection from floods and storm surge, and plants provide food, habitat, refuge, and nursery grounds for many fish, birds, invertebrates and small mammals.

Animation Image Ideas:

First Image – Happy Raindrop

img_1403

Wetlands are not completely dry, nor are they bodies of water . . .

img_1404

Wetland Water Sources

img_1408

Hydric Soils

img_1406


Project Proposal

In 2015, 12.7 percent of U.S. households were food insecure. Of those, 7.7 percent were households with low food security and the other 5 percent were households with very low food security. The U.S. Department of Agriculture (USDA) defines food insecurity, low food security and very low food security as follows:

Food Insecurity – at times during the year, these households were uncertain of having, or unable to acquire, enough food to meet the needs of all their members because they had insufficient money or other resources for food. Food-insecure households include those with low food security and very low food security.

Low food security – households obtained enough food to avoid substantially disrupting their eating patterns or reducing food intake by using a variety of coping strategies, such as eating less varied diets, participating in Federal food assistance programs, or getting emergency food from community food pantries.

Very low food security – normal eating patterns of one or more household members were disrupted and food intake was reduced at times during the year because they had insufficient money or other resources for food.

About 160,000 indigenous Inuit people (from Canada, the United States (U.S.), Greenland and Russia) are affected by food insecurity and currently, there is a lack in effective and sustainable policies that take into consideration indigenous perspective. The traditional components of food insecurity include availability, access, quality and utilization however, Alaskan Inuits view food security as the natural right of all Inuit to be part of the ecosystem, to access food and to care-take, protect and respect all of life, land, water and air. It is characterized by environmental health and is made up of six interconnecting dimensions, which include: availability; Inuit culture; decision-making power and management; health and wellness; stability; and accessibility. (Inuit Circumpolar Council-Alaska 2015. Alaskan Inuit Food Security Conceptual Framework: How to Assess the Arctic From an Inuit Perspective: Summary Report and Recommendations Report. Anchorage, AK.)

PROJECT

My communication project aims to present how indigenous communities view food security, how current policies impede progress in this area, through the use of a 1-page policy brief and infographic. Both the policy brief and infographic will address three key issues: a) the lack of subsistence priority, b) harvest disasters and c) impacts of increased activity in the region, with an explanation of how Alaskan indigenous communities view food security as its foundation.

PURPOSE

The purpose of this project is to educate and communicate the nuances of food security when it involves Arctic Indigenous communities.

AUDIENCE

I plan to address state government officials as well as share my project with key members and representatives of the Alaskan indigenous communities with the goal of making sure that I capture specific nuances.

It is my hope that my project and information shared will be the catalyst that encourages state policy makers to review current policies and engage with the Alaskan subsistence communities to develop and implement policies that are better suited to dealing with food security.

Next Steps

  1. Identify more information for one-pager
  2. Develop key takeaways
  3. Begin researching and select possible images to use for infographic
  4. Develop list of possible state officials to brief

Project Proposal

Background

The management of a recreational fishery composed of multiple predatory species can pose a challenge to managers, as they must maintain both the ecological balance of the system and the satisfaction of divergent angler groups who may have competing interests. Historically when either the ecological or social perspective of a system or fishery has been ignored, the result is often a damaged relationship between the resource users and the managing agency (Churchill et al. 2002). Fisheries managers must understand how interactions between predators—real or perceived—affect angler perceptions of predator species. Ideally, fisheries managers can use their understanding of the occurring biological interactions to educate anglers and appropriately address any concerns and conflicts that might be present. Such conflicts exist for many recreational fisheries and are especially prevalent in fisheries surrounding large predators like muskellunge Esox masquinongy.

Muskellunge and other esocids have held a bad reputation amongst anglers for over a century (Hall 1987) and have been cited as the cause of declines in many sportfish populations over the years, including walleye Sanders vitreus (e.g. Scidmore 1964, Maloney and Schupp 1986), crappies Pomoxis spp. (e.g. Siler and Beyerle 1984), and black bass Micropterus spp. (e.g. Krishka et al. 1996, Kerr and Grant 2000). Despite these claims, evidence of muskellunge preying on and altering other sportfish populations is equivocal. Many populations of muskellunge and other sportfish, like smallmouth bass Micropterus dolomieu and walleye, exist together naturally in North America and support successful recreational fisheries (e.g. Thomas and Haas 2004, Knapp et al. 2012). Other systems exist, however, in which direct predation on other sportfish populations by muskellunge seems to be a major issue (e.g. Schmidtz and Hetfeld 1965). Thus, the muskellunge and smallmouth bass populations of the New River, Virginia provided an ideal opportunity to study and improve our understanding of the interactions between muskellunge and another popular sportfish.

Our research studied the importance of smallmouth bass in muskellunge diet in the New River, Virginia. Over two years we collected the stomach contents from 274 muskellunge using pulsed-gastric lavage. Food items were identified to the lowest level of taxonomic resolution possible, weighed (wet weight), and measured (TL for fish). We found that consumption of smallmouth bass by muskellunge was very limited. Smallmouth bass represented only 1% (of total wet weight) of muskellunge diet. The primary prey items consumed by muskellunge were suckers Catostomidae spp., smaller centrarchids (i.e. Lepomis spp. and rock bass Ambloplites rupestris), and minnows Cyprinidae spp. These prey items were consistent with those found in the diet of New River Muskellunge in 2000-2003 (Brenden et al. 2004) and with muskellunge diets reported for other systems (Kerr 2016).


Project Proposal

The product I intend to create is a ‘flier’ with a QR code—a barcode that can be scanned with a cellphone. The QR code will take the scanner to a short 5-minute video on the project’s findings. The QR code, along with the video’s web address, will be printed on waterproof fliers and available at local tackle shops, guiding services, and boat ramps. If possible, I would also like to have the QR code and web address printed in local fishing publications. New River anglers are a diverse group, each with his or her own level of familiarity with technology. Reaching the different types of anglers will likely require multiple mediums. Thus if time permits, I would like to advertise several viewings of the video on the fliers and hold Q-and-A segments following the video.


Intended Audience

New River anglers are my intended audience for this project, especially those that fish for smallmouth bass and muskellunge. Smallmouth bass anglers in particular are concerned about the impact Muskellunge have on the quality of the bass fishery, and this research should help ease their concerns.


References

Brenden, T. O., E. M. Hallerman, and B. R. Murphy. 2004. Predatory impact of Muskellunge on New River, Virginia, Smallmouth Bass. Proceedings of the Southeastern Association of Fish and Wildlife Agencies 58:12-22.

Churchill, T. N., P. W. Bettoli, D. C. Peterson, W. C. Reeves, and B. Hodge. 2002. Angler conflicts in fisheries management: a case study of the Striped Bass controversy at Norris Reservoir, Tennessee. Fisheries 27:10-19.

G. E. Hall. 1987. Managing muskies. American Fisheries Society, Special Publication 15, Bethesda, Maryland.

Kerr, S. J. 2016. Feeding habits and diet of the Muskellunge (Esox masquinongy): a review of potential impacts on resident biota. Muskies Canada Inc. and Ontario Ministry of Natural Resources and Forestry. Peterborough, Ontario.

Kerr, S. J. and R. E. Grant. 2000. Muskellunge and northern pike. Pages 325-355 in Ecological impacts of fish introductions: evaluating the risk. Fisheries Section, Fish and Wildlife Branch, Ontario Ministry of Natural Resources. Peterborough, Ontario.

Knapp, M. L., S. W. Mero, D. J. Bohlander, D. F. Staples, and J. A. Younk. 2012. Fish community responses to the introduction of muskellunge into Minnesota lakes. North American Journal of Fisheries Management 32:191-201.

Krishka, B. A., R. F Cholmondeley, A. J. Dextrase and P. J. Colby. 1996. Impacts of introductions and removals on Ontario percid communities. Report of the Introductions and Removals Working Group, Percid Community Synthesis. Ontario Ministry of Natural Resources. Peterborough, Ontario.

Maloney, J. and D. H. Schupp. 1977. Use of winter rescue northern pike in maintenance stocking. Fisheries Investigational Report 345. Minnesota Department of Natural Resources. St. Paul, Minnesota.

Schmidtz, W. R. and R. E. Hetfield. 1965. Predation by introduced Muskellunge on perch and bass II: Years 8-9. Transactions of the Wisconsin Academy of Science Arts and Letters 54:274-282.

Scidmore, W. J. 1964. Use of yearling northern pike in the management of Minnesota lakes. Fisheries Investigational Report No. 277. Minnesota Department of Natural Resources. St. Paul, Minnesota.

Siler, D. H. and G. B. Beyerle. 1984. Introduction and management of northern muskellunge in Iron Lake, Michigan. American Fisheries Society Special Publication 15:257-262.

Thomas, M. V., and R. C. Haas. 2004. Status of the Lake St. Clair fish community and sport fishery, 1996-2001. Michigan Department of Natural Resources, Fisheries Division.


Musical Parody Proposal

Salt marsh loss due to accelerated sea-level rise is a major concern, particularly in regions such as the coast of North America, where sea-level rise is 3-4 times greater than the global average. Fortunately, salt marshes have methods for keeping pace with sea-level rise. One such method is landward migration. Marshes move into and displace upland forests, as sea level rises. Another method of resilience is vertical accretion. Salt marshes can build up vertically by trapping sediments, facilitate by plants, on the marsh surface. However, we don’t know how animals, which interact with the plants, influence the trapping of sediments. Therefore, the goal of my research is to understand how animals are affecting sediment deposition, and ultimately vertical accretion, through their interactions with the plants. Specifically, I study two species of crabs, which interact with plants in contrasting ways. The marsh fiddler crab (Uca pugnax) facilitates plant production, while the purple marsh crab (Sesarma reticulatum) eats plants. However, these two species co-occur along a major portion of the North Atlantic coastline (Virginia to Cape Cod, MA) and their net effects on sedimentation could be very interesting. Understanding these effects could also be useful in understanding salt marsh resilience in the face of accelerated sea-level rise.

Multiple stakeholder groups could benefit from learning about my research. For this project, I will focus on young students living in coastal areas of North America. The group I’m targeting can span between early middle school and late high school. By targeting this group I will 1) demonstrate the threat of sea-level rise in their own backyards at an earlier age than generally climate change is taught and 2) reinforce the important of coastal ecosystems. Salt marshes provide habitat for many commercially important species, store carbon, and serve as storm protection, however many young students do not know the importance of this coastal habitat, and its role in their daily lives. By targeting this group, I can help to encourage the idea of conservation of coastal habitats early on in their life. Sharing research with students of this age could also demonstrate how research is done and that working in science does not just mean working in a lab on a microscope, and can be a wide range of experiences.

For this project, I would like to develop a musical parody to a popular song. A popular song will be easily recognized by my target group and provide an instant “hook” because they will recognize it. Some examples of this being done are: “Snail” by ASHELLNATION, which is a parody of “Sail” by AWOLNATION. Another example is “Anaconda-The Educational Version” by College Humor, which parodies “Anaconda” by Nicki Minaj. In these parodies, lyrics of modern songs are manipulated to reflect some educational information. I will choose a popular song and modify the lyrics to explain the importance of salt marshes, the background of my research, and some results from the research I conducted this summer.

In addition to changing the lyrics of the chosen song to reflect my research, I will also include a music video that has images, cartoons, figures, and other pictures to help enhance the understanding of the research that is being sung about. Because sometimes song lyrics can be hard to understand, this music video will feature the lyrics of each frame along the bottom. The final product, song with altered lyrics and music video, will be uploaded to YouTube, my personal website and shared via Twitter.

Project Proposal

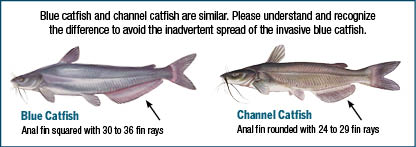
Overview—. Blue catfish are native to the Mississippi, Missouri, and Ohio drainages, and were introduced into Virginia’s tidal rivers during the 1970s and 1980s. They are now extremely abundant and have been a controversial topic over the last decade. Some detest the species, citing perceived ecosystem changes after their introduction, while others rely on the fishery for their livelihood. After communicating with various angler groups in Virginia, it became clear to me that many members are frustrated with the media coverage of “invasive” blue catfish in the Chesapeake Bay. Local anglers are confused as to why blue catfish have been labeled as an invasive, while other non-natives have gotten a free pass.

maryland-bcf-invasive

MD DNR has posted this sign at numerous boat ramps. Why are non-native blue catfish (from the Mississippi River) labeled as invasive, while channel catfish (also from the Mississippi River) are not?

Definitions of “invasive species” vary broadly, and should be separated from “non-native” or “exotic” labels (Lockwood et al. 2013). Many people do not realize that most of Virginia’s freshwater fisheries revolve around non-native species, including largemouth bass, smallmouth bass, rainbow trout, brown trout, muskellunge, and channel catfish (Jenkins and Burkhead 1994). So why do blue catfish receive an invasive label? What separates them from all the other non-native fish that continue to be protected and stocked in Virginia waters?

Outreach Product—. My goal here is to develop a simple, streamlined blog post that provides an overview of the various definitions for an invasive species, much of which will come from Invasion Ecology (Lockweed et al. 2013). I will also address the definition of invasive species as defined by the National Invasive Species Council, which takes a more objective, quantitative approach to Executive Order 13112 (ISAC 2006). Further, I will review the history of non-native freshwater fish introductions, many of which have been very beneficial (Gozlan 2008; Gozlan et al. 2010).

After defining invasive species, I will present the most recent science on the life history of blue catfish within the Chesapeake Bay. I will then prompt readers to decide, based on the evidence, whether or not blue catfish should be labeled as an invasive in Virginia’s tidal rivers.

Desired impact—. I will clearly define what an invasive species is, while avoiding the jargon found in my source material (NISC 2006; Lockwood et al. 2013). I will also explore the history of non-native fish introductions throughout the U.S. and in Virginia. I will then briefly discuss the life history characteristics of blue catfish and ask the readership to decide, on their own, whether or not blue catfish should be considered an invasive species within the Chesapeake Bay. I want readers walking away with a clearer understanding of what an invasive species is, and I also want readers to understand the history of non-native fish in Virginia. Furthermore, I want readers to understand some of the basic biological characteristics of an invasive species, which I will then relate to blue catfish biology.

Desired audience—. My intended audience is Virginia angler groups who fish in VA tidal rivers. However, due to the ease of distributing information on the internet, I will also distribute the materials to other stakeholders that utilize Bay’ resources. This will be posted on my existing outreach website (www.chesapeakecatfish.com), and I hope to use peer evaluations to keep the materials clear and concise.

References

Gozlan, R. E. 2008. Introduction of non‐native freshwater fish: is it all bad? Fish and Fisheries 9(1):106-115.

Gozlan, R. E., Britton, J. R., Cowx, I., and G. H. Copp. 2010. Current knowledge on non‐native freshwater fish introductions. Journal of Fish Biology 76(4):751-786.

Jenkins, R. E., and N. M. Burkhead. 1994. Freshwater Fishes of Virginia. American Fisheries Society, Bethesda, Maryland.

(ISAC) Invasive Species Advisory Committee. 2006. Invasive species definition clarification and guidance white paper. National Invasive Species Council.US Department of Agriculture, National Agricultural Library. Washington, DC. Available at http://www.invasivespeciesinfo.gov/docs/council/isacdef.pdf. (Oct 2016).

Lockwood, J. L., Hoopes, M. F., and M. P. Marchetti. 2013. Invasion Ecology. John Wiley & Sons, Hoboken, New Jersey.

Project Proposal_Goldsmith

The Atlantic bluefin tuna, while considered overfished, supports a popular, high-economic-output recreational fishery along the U.S. east coast from Maine to North Carolina. Due to the highly migratory nature of bluefin tuna, the species is managed internationally throughout the Atlantic Ocean, with the United States receiving an annual allocation as a percentage of the Atlantic-wide total allowable catch, which it apportions domestically among different users (i.e., commercial and recreational fishermen). It is imperative that the United States maintain its landings within the designated quota in order to avoid international sanctions.

While domestic commercial landings can be monitored in near-real-time due to strict reporting requirements for fishermen and seafood dealers, tracking recreational bluefin tuna harvest has presented a persistent challenge for the National Marine Fisheries Service. While catch reporting is also required for the recreational fishery, compliance is extremely low, estimated at about 20%. In addition, landings by the recreational sector can fluctuate widely from year to year due to changes in fish availability or to regulations, each of which can affect angler behavior—for example, the number of anglers participating in the fishery, and the intensity of their fishing effort. Better understanding the drivers of bluefin tuna angler effort is critical for predicting bluefin tuna harvest by the recreational sector and preventing landings that exceed the United States’ internationally designated quota. At the same time, examining the decision-making, preferences, and values of recreational Atlantic bluefin tuna anglers will serve to quantify the benefits that recreational fishermen derive from the resource, as well as to identify the components of the fishing experience that contribute to those benefits. By surveying recreational anglers and employing econometric modeling techniques to tease out their motivations, preferences, and values, my research will inform the development of management strategies that maximize angler welfare while maintaining catches within prescribed limits.

I believe that the recreational bluefin tuna fishing community along the U.S. east coast would benefit from learning about my research and its implications. Specific examples of audiences I may target include charter boat association members, visitors to recreational fishing trade shows/exhibitions, and big-game tournament participants. I have observed many recreational anglers exhibit a sense of distrust and lack of confidence in the domestic fishery management system; I believe that such sentiments are largely due to a) a lack of understanding of the work that is occurring and its purpose, and b) the absence of a personal connection or sense of solidarity with individuals who are conducting such research. Given the highly collaborative nature of this work, which relies on survey data, my economic research represents an excellent opportunity to communicate the type of research that is being conducted on behalf of recreational anglers while also demonstrating the benefits that can result when fishermen, fisheries scientists, and managers work together toward a common goal.

The product I intend to develop will be a photo essay for exhibition to recreational anglers. The photo essay will explain the challenges of managing the recreational bluefin tuna fishery while illustrating the methods that I will use to tease out the motivations and values of anglers. For example, how much do anglers value harvesting a tuna compared to catching and releasing a tuna? Through my field work with bluefin tuna fishermen, I have assembled a broad array of compelling images to engage the audience and provide tangible examples of how my research relates to—and seeks to benefit—recreational bluefin tuna anglers.  While the photo essay will touch on the goal of being able to better predict angler effort and harvest, I will focus my photo essay on the need for quantifying the benefits recreational anglers derive from the fishery, which can be a difficult concept to explain (most fishermen tend to think more about expenditures when they hear fisheries economics). The photo essay will be exhibited on a large poster, or perhaps a series of posters. While I do not know the full range of venues at which I would present the final product, I am currently scheduled to speak about my research to the Stellwagen Bank Charter Boat Association (http://stellwagenbank.org/) on April 11, 2017, and would certainly display the photo essay there.

Project Proposal

Over the last few years, several commercial oyster growers in Virginia have reported significant mortality events of their oysters during the spring and summer months.  The summer of 2014 was the worst on record, as growers across the state reported summer mortality, most severe on the Eastern shore and in some cases as high as 85% of the crop (Karen Hudson, personal communication).  Severe mortality events like that in 2014 are of major concern to industry stakeholders.  As an industry collaborator put it, “this is a matter of the viability of the oyster aquaculture industry in Virginia.”

My research team is in a unique position to address this issue because we’ve deployed genetically different oysters to previously affected commercial farms and have been gathering data since February of this year.  In the late spring, we witnessed a mortality event at one of the commercial farms specific to only the triploid oysters. No other significant mortality events were observed across our other sites.  Our mission now is to scientifically determine what was different about these oysters that caused a significant number of them to die.  The research will be foundational to understanding the gene x environment interaction that is causing summer mortality events of commercial oysters.

The industry stakeholders, namely the farmers and hatchery managers, are very interested in this research because they want to know why the oysters are dying.  It currently remains a mystery, and given the timing of this workshop, I will likely not have the ‘smoking gun’ to communicate in my product.  In lieu of the answer, I’d like to share the crux of the analysis we are undertaking to get at the answer.  With a better understanding of our analysis, I think the stakeholders will appreciate the strides we are making to get the answers and will gain confidence that we are capable of addressing the problem.

My goal is to produce a clear, jargon-less, non-traditional form of communicating the ideas behind our lab work so that the industry stakeholders gain a better understanding of how we are addressing the issue.   I think the best way to do this is by developing a short video that explains the big topics we are investigating through our analysis in the lab.  These big topics are the variation in reproductive development in triploids and the associated health of these oysters.   Ideally, the audio would be able to stand alone so I could disseminate that separately.  I’m inspired by Abby Lunstrum’s stop-motion photography animation, and think that may be the route I will go, however I’m not big on arts and crafts.  I am considering other ways to produce the images besides drawing and cutting.

Project proposal

Current eastern oyster fishery production is a fraction of what it was a century ago due to overfishing, habitat destruction, disease, and pollution. Recently however, oyster aquaculture has begun to rebound, largely due to the development of disease resistant oyster and increased use of intensive aquaculture practices (cages, racks, or floats). Parallell to this rebound in production has been an increase in the area of subaqueous leases in Virginia for oyster growing. Currently, over 120,000 acres of bottom are leased and applications for 25,000 acres are pending—up from just 90,000 leased acres only a decade ago and approaching the historical maximum of 134,000 acres attained in the 1960’s. Despite these positive trends, several factors may inhibit continued industry growth. Tensions between the Virginia aquaculture industry and the public have increased substantially over the last few years. In coastal communities like those along the densely populated Lynnhaven River conflict with oyster aquaculturists has largely centered on the use of intensive aquaculture methods, which are argued to be unsightly and possibly even dangerous to bay recreational activities. Though aquaculturists contend their efforts are providing much needed jobs and economic stimulus while simultaneously enhancing water quality and restoring the Bay, coastal property owners worry about the industry’s effect on property values and safety.

Oyster leasing is currently facing some critical users conflicts. Property owners associate oyster leases and aquaculture with “the evil” (pers.com.) and tend to claim that oyster cages are “everywhere”. One of my communication goal for this project is to reduce this misperception of the impacts of oyster leasing and try to communicate the benefits associated with growing oysters to this coastal property owner community. That’s why my key audience will be mainly property owners and local communities but this tool will also greatly benefit managers at VMRC.

I would like to develop a one-page infographic about Virginia oyster leasing representing these points:

  • Fact sheet/ fact numbers about local productivity and economy from oyster growing activities and aquaculture benefits
    • Oyster aquaculture benefits
      • environmentally
      • economically
      • socially
        • Include some historical context (historical photos from the 1960’s when oyster production was at its peak)
      • Relative extent of intensive oyster aquaculture in the Lynnhaven River
        • Google Satellite image (to see where the cages really are)
      • Some simple diagrams/ pie (number of leases, number of lease holders, % of intensive use)
    • Diagram of the leasing process that can currently be found at this page but under text format http://www.mrc.state.va.us/Shellfish_Aquaculture.shtm to encourage the use of lease and/ or people to apply for a lease.
      • Include contact information of VMRC Oyster Ground lease program.

I am still not sure how and where I will distribute this communication product. Probably I will try to pin some at local recreational businesses around Lynnhaven river (eg kayak, jet skis rental store) or distribute some at fresh markets or seafood festivals.

Project Proposal

Background

Sea surface temperature (SST) increases due to anthropogenic carbon dioxide emissions are causing a decline in the health of marine ecosystems worldwide―including both temperate and tropical coral habitats (Hoegh-Guldberg & Bruno 2010). Although the effects of rising SST on tropical corals have been well explored (Barshis et al. 2010; Castillo et al. 2014), corals inhabiting temperate hard bottom ecosystems, for example off the coast of Virginia, remain understudied. Sea surface warming has been more prominent in the North Atlantic compared to other ocean basins (Rhein et al. 2013); hence the need to understand how temperate corals will respond to SST increases is urgent. Along with rising ocean temperatures, rapid population growth and human activities in coastal watersheds have caused increased stress within coastal waters globally. Human development along coastal watersheds has increased nutrient loading leading to eutrophication, which, along with sedimentation, has modified primary and secondary production and altered the trophic structure of temperate coastal ecosystems (Gilbert et al. 2014; Paerl et al. 2003; Paerl et al. 2006).

For my masters work, I am studying Astrangia poculata, the Northern Star Coral, because it is a temperate species and its environment is experiencing significant changes in primary and secondary production coupled with increased SST (Paerl et al. 2003; Gilbert et al. 2014; Rhein et al. 2013). A. poculata is a temperate scleractinian coral widely distributed from the northwestern Atlantic to Florida and the Gulf of Mexico (Dimond and Carrington 2008; Kaplan 1988). A. poculata is an important member of the temperate hard bottom community, which provides shelter and habitat for juvenile fish and other invertebrates and also supports various commercially and recreationally important species (Kennish 1999; Deaton, Chappell et al. 2010). A. poculata is also dominant on Mid-Atlantic shipwrecks (up to 75% cover in some areas; D. Barshis pers. observation). These wrecks are a key resource for local fisherman and SCUBA diving operators along the Virginia coast. A. poculata can survive with (symbiotic) and without (aposymbiotic) their symbiotic algae and is thus termed facultatively symbiotic (Dimond and Carrington 2008). The response of corals with facultative symbioses to climate change is understudied, making the study species unique. The trophic ecology of temperate corals may be more complicated than that of tropical corals (obligate symbiosis) and little is understood of the physiological changes to carbon acquisition in A. poculata when bleached. This highlights the importance of understanding how facultatively symbiotic corals like A. poculata could change their methods of obtaining carbon under thermal stress. Understanding A. poculata’s response to temperature stress will allow us to predict how benthic hard bottom ecosystems may shift in the face of a changing climate and will help inform environmental management decisions for hard bottom ecosystems in Virginia and the Southeastern United States.

Project Description

My outreach product will be a video that introduces the viewer to corals off the coast of Virginia, specifically my study species (Astrangia poculata, Northern Star Coral) and the goals of my research. The video will start with the process of getting out to my study site, which is 13 miles off the coast of Virginia Beach at the Chesapeake Light Tower. After taking the viewer out to my site, I will take them underwater to the shipwrecks that A. poculata calls home. I will include footage of collecting the corals, as well as the process of collecting other data at my sites such as temperature and light levels. The video will follow the field work process all the way back to the lab, and demonstrate how I maintain corals in aquaria at Old Dominion University. I will finish up with some details about my masters project and what I hope to learn from my experiments.

I plan to utilize a mix of footage taken in the field as well as photographs and potentially cartoons to illustrate the main points of my research. For example, I plan to communicate to viewers the basic idea of what a coral is by pausing the video on an image of a coral in the field, and then overlay the image with a cartoon demonstrating that a coral is a plant, animal, and rock all rolled into one. Along with communicating this in the video, I plan to bring coral specimens with me to the Virginia Aquarium during outreach events to physically show visitors the different aspects of a coral.

I traveled out to my site earlier this week and already have some wonderful footage to include in this video! The visibility was very poor, but I think it will be a great way to demonstrate the difficulties of field work to the viewer.

Desired Impact

As the outreach component of my Virginia Sea Grant Graduate Research Fellowship, I have partnered with the educators at the Virginia Aquarium to communicate my research. I therefore want to make this video a product that the Virginia Aquarium will be able to utilize, even after I am no longer a graduate student at ODU. The target audience for this video will be the many visitors to the aquarium. In communicating with the public about my research on temperate corals, I have been surprised that few people are aware that there are corals off the coast of Virginia. I hope that this video will serve to inform the public about corals in their own backyard, and even though I can’t physically take the Virginia Aquarium visitors underwater with me, I hope to make them feel like they have experienced this environment, and therefore help them to feel connected to it and want to protect it.

I have already planned several outreach events with the Virginia Aquarium at which I can show this video. This includes a program called Lunch and Learn, which is lunchtime event with the aquarium docents and provides me the opportunity to teach those who will then teach many others about my research and Virginia corals. I will also be working with the Mentoring Young Scientists program and talking with young, aspiring scientists about my work.


Literature Cited

Deaton A., Chappell W., Hart K., O’Neal J. & Boutin B. (2010). North Carolina Coastal Habitat Protection Plan. In: (ed. North Carolina Department of Environment and Natural Resources DoMF) Morehead City, North Carolina, pp. 424-426.

Dimond, J. and E. Carrington (2008). Symbiosis regulation in a facultatively symbiotic temperate coral: zooxanthellae division and expulsion. Coral Reefs 27(3): 601-604.

Paerl H.W. (2006). Assessing and managing nutrient-enhanced eutrophication in estuarine and coastal waters: Interactive effects of human and climatic perturbations. Ecological Engineering, 26, 40-54.

Paerl H.W., Valdes L.M., Pinckney J., Piehler M., Dyble J. & Moisander P. (2003). Phytoplankton photopigments as indicators of estuarine and coastal eutrophication. Biosciences, 53, 953 – 964.

Hoegh-Guldberg O. & Bruno J.F. (2010). The impact of climate change on the World’s marine ecosystems. Science, 328, 1523-1528.

Barshis D.J., Stillman J.H., Gates R.D., Toonen R.J., Smith L.W. & Birkeland C. (2010). Protein expression and genetic structure of the coral Porites lobata in an environmentally extreme Samoan back reef: does host genotype limit phenotypic plasticity? Molecular Ecology, 19, 1705-1720.

Castillo K.D., Ries J.B., Bruno J.F. & Westfield I.T. (2014). The reef-building coral Siderastrea siderea exhibits parabolic responses to ocean acidification and warming. Proceedings of the Royal Society B: Biological Sciences, 281.

Rhein M., Rintoul S.R., Aoki S., Campos E., Chambers D., Feely R.A., Gulev S., Johnson G.C., S.A. J., Kostianoy A., Mauritzen C., Roemmich D., Talley L.D. & Wang F. (2013). Observations: Ocean. In: Climate Change 2013: The Physical Science Basis. Contribution of Working Group I to the Fifth Assessment Report of the Intergovernmental Panel on Climate Change. In: (ed. Stocker TF, D. Qin, G.-K. Plattner, M. Tignor, S.K. Allen, J. Boschung, A. Nauels, Y. Xia, V. Bex and P.M. Midgle) Cambridge, United Kingdom and New York, NY, USA.

Gilbert M.G., Hinkle D.C., Sturgis B., Jesien, R.V. (2014). Eutrophication of a Maryland/Virginia Coastal Lagoon: a Tipping Point, Ecosystem Changes and Potential Causes. Estuaries and Coasts, 37.

Kaplan EH. (1988). A field guide to southeastern and Caribbean seashores: Cape Hatteras to the Gulf coast, Florida, and the Caribbean. Houghton Mifflin Co. Boston, MA. USA. 425 pp.

Kennish MJ. (1999). Estuary Restoration and Maintenance: The National Estuary Program. CRC Press, 376 pp.

Project Proposal

Seagrasses increase water clarity, reduce erosion, store carbon, and provide habitat for hundreds of species, including commercially and recreationally important fish (Zieman 1982; Koch et al. 2006). However, seagrasses are subject to a variety of threats including dredging, climate change, and eutrophication. As a result, these important ecosystems are declining globally (Orth et al. 2006). However, populations of seagrasses that have high genetic diversity are more resilient to environmental stressors and contribute more ecosystem services (Hughes & Stachowizc 2009; Reynolds et al. 2012). My research is focused on the genetic population structure of the tropical seagrass Halodule wrightii in Florida, North Carolina, and Bermuda. Seagrasses can reproduce sexually and asexually and morphology cannot differentiate between clones and unique genotypes, so genetic techniques are important for distinguishing between areas of low and high genetic diversity. My study uses microsatellite primers, which are areas of the DNA that consist of short repeat sequences and do not code for proteins. The genetic diversity measures found in this study can contribute to restoration decisions by identifying ideal donor beds and establishing a baseline of diversity for natural beds.

I have found it difficult to explain the importance of genetic diversity both to members of the public and to other scientists because genetic terms can quickly become jargon. For that reason, I want to create a product that can be useful for audiences at different levels of scientific knowledge. I plan to make 2 infographics to target these different groups. The first will be directed towards a general, public audience that discusses the different levels of diversity within seagrass beds and the interactions between levels.  This infographic will attempt to convince the audience that we should care about diversity of seagrass at all levels, but particularly the genetic level since it has feedbacks into the ecosystem level and can make up for the low species diversity of seagrass beds (Duffy 2006). I think high school science teachers might find this product especially useful, and I am going to try to find a website containing resources for teachers that would accept the infographic as a tool for teaching diversity. Infographic 2 will be more of a case study displaying the data from my genetic diversity study and relating it to restoration in the Florida Bay area following a recent dieback. The target audience will be scientists outside the field of genetics, restoration groups, or more scientifically inclined members of the public. This infographic will be useful to me during my thesis defense, as well as during any future talks about my work.

I believe infographics might be the best medium for accomplishing my goal because they are visually appealing and are great for reducing information to the “take home” messages. After looking at a couple of tools that help to make infographics I think I’ll use Canva because I like their templates and the ease with which items manipulated. However, I’m open to suggestions about other ways I can convey this information!

The topics discussed in the first infographic will be:

  1. The problem: Seagrasses are declining globally
  2. Diversity can help prevent declines AND increase ecosystem services
  3. Levels of diversity
    1. Ecosystem level (the different species utilizing seagrasses as habitat)
    2. Species level (the number of seagrass species that make up the base of the ecosystem)
    3. Genetic level (the number of different genotype, or unique individuals*, within a given seagrass bed)

*Important to explain that seagrasses can produce either sexually or asexually

Feedbacks into ecosystem level

The topics discussed in the second infographic will be:

  1. Graphic of how genetic diversity data was obtained
    1. Visual of sampling scheme
    2. Visual of DNA region being targeted and amplified using microsatellite primers. This will be kept as simple as possible
  2. Common restoration techniques; pros and cons of each in terms of success, impact on donor beds, and implications for genetic diversity of restored areas
    1. Vegetative fragments vs transplants
  3. Overlay map
    1. Area in Florida Bay affected by the summer 2015 seagrass dieback
    2. Relative genetic diversity of 5 sites within Florida Bay (based on number of unique genotypes present within a sampling area)

Literature Cited:

Duffy JE (2006) Biodiversity and the fuctioning of seagrass ecosystems. , 233, 233–250.

Hughes AR., Stachowicz JJ (2009) Ecological impacts of genotypic diversity in the clonal seagrass Zostera marina. Ecology90, 1412–1419.

Koch EW, Ackerman JD, Verduin J, Kuelen M Van (2006) Fluid Dynamics in Seagrass Ecology—from Molecules to Ecosystems. Seagrasses: Biology, Ecology and Conservation, 193–225.

Orth RJ, Carruthers TJB, Dennison WC et al. (2006) A Global Crisis for Seagrass Ecosystems. BioScience, 56, 987.

Reynolds LK, McGlathery KJ, Waycott M (2012). Genetic Diversity Enhances Restoration Success by Augmenting Ecosystem Services. PLoS ONE7, e38397. http://doi.org/10.1371/journal.pone.0038397

Zieman JC (1982) Ecology of the seagrasses of south Florida: a community profile (No. FWS/OBS-82/25). Virginia University, Charlottesville (USA). Dept. of Environmental Sciences.

Outreach Product Proposal

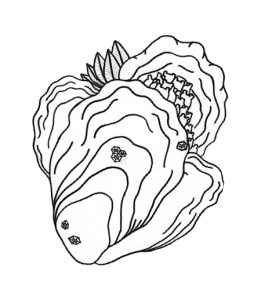
Oysters are the darlings of the Chesapeake. Oyster Bio Clump
People here have a profound sense of pride in the little reef-forming bivalves, and with good reason. Oysters provide numerous ecosystem services such as filtering our water, dampening erosive wave energy with their reefs, and providing habitat for a plethora of other species. They also support a fishery that has been crucial to human settlements for hundreds of years. Because of this, the public is well aware of the oyster narrative and concerned by the oyster’s struggle with disease since the 1960’s. I plan to use this innate interest to disseminate my research on oyster adaptation to disease.
My outreach product will be a shareable social media graphic created in Adobe Illustrator and InDesign depicting the socio-economic impact of oyster disease in the Chesapeake Bay. Data used will include oyster landings from the Virginia Marine Resources Commission, disease severity and prevalence from scientific literature, and economic data from Maryland and Virginia. It will be heavy on appealing visuals with as little text as possible. I want the message to come across quickly and easily through a carefully arranged series of graphs and images. I will likely make my own illustrations for this project in addition to using symbols from the Integration & Application Network. I plan to distribute the finished product through Twitter and Facebook. I am choosing to focus on this topic over the other two infographics (disease ecology and evolution of marine diseases) that I plan to make before graduation because the fishery just opened for the season and I believe there will be interest in the topic of the oyster industry and economics.
The infographic will start with some background on oysters and their value to the Chesapeake Bay. The introduction will lead into a graph of oyster landings over time. There is a precipitous drop in the oyster seed industry and wild harvest in the late 1950’s and 1980’s, respectively. This coincides with two major disease outbreaks. From there, I can explain the economic impact on Maryland and Virginia in terms of loss of money to the industry and also the social costs, such as the loss of jobs. I also hope to present a light at the end of the tunnel by summarizing some current oyster disease research, which indicates that the situation is improving.
My intended audience is coastal landowners and the Chesapeake community, but the distribution of the product will not be controlled, as it will be shareable on social media. Therefore, I hope to make it interesting to the general public because I am not sure who will come across it. Despite this, I still want to tailor the product to coastal landowners of the Chesapeake. My goal is to educate them about what is occurring in their backyards. I want to raise awareness about oyster disease as a way to get people interested in the disease and adaptation research that I am doing. I am hoping that this graphic will supply the “why we should care” portion of communicating my research because it will illustrate how disease has impacted the areas that the target audience inhabits.

Project Proposal – What Makes a Wetland?

Defined as first- and second-order streams, headwaters and their adjacent wetlands establish the beginning of a river network. Located at the interface between uplands and surface water networks, headwater wetlands intercept shallow ground water and surface runoff, acting as a natural filter to improve downstream water quality. Important ecosystem functions provided by headwater wetlands include sediment retention, flood attenuation, and the removal of pollutants/excess nutrients. Headwaters also contribute to regional biodiversity by providing habitat/refuge, and sustain downstream aquatic and riparian biota by exporting essential products such as food, nutrients, and woody debris.  As compared to higher order streams, the loss or degradation of headwater wetlands is expected to have a disproportionate impact on downstream water quality.

Hydrology is the single most important factor driving the structure and function of wetlands, including headwater systems. Changes in hydrologic cycles resulting from land use and climate change have contributed to the degradation of streams, wetlands, and other aquatic ecosystems throughout the nation. The consequences of altered hydrology have been studied extensively in many aquatic ecosystems, however it is unclear to what extent land use and climate change will affect the hydrologic regime of headwater wetlands, particularly in flat coastal landscapes such as the coastal plain of Virginia.

Despite no net loss policies and specific guidance for mitigation of wetland impacts, Virginia continue to lose wetlands and ecosystem service capacity through both permitted activities and natural processes. My dissertation research seeks to inform the conservation and management of Virginia’s headwater wetlands by 1) identifying which wetlands are most vulnerable to climate change in the coastal plain of Virginia and 2) describing how the character and condition (i.e., land use) of headwater catchments influence their vulnerability to climate change stressors.

While direct wetland impacts such as filing and draining are immediately obvious, the indirect hydrologic impacts due to land use and climate change that I study require some understanding of wetland hydrology. An important concept fundamental to my research is the movement of water to and from headwater wetlands. One component of this work involves modeling water table fluctuations that contribute to the formation of wetlands in the coastal plain. The soil saturation conditions required to establish and maintain a wetland are consistent between all wetland types – the main differences being how the water is transported to and from the wetland. Therefore I would like to develop a product that teaches the fundamentals of wetland hydrology, in other words, what makes a wetland a wetland?

I plan to create a short (2-3 minute) whiteboard animation describing the hydrology of wetlands that could be used as an educational tool in schools and for the general public. I expect this product would be most appropriate for middle and high school aged students, and would complement lessons on the water cycle and/or wetlands. However, since it would not require in depth understanding of the water cycle, it could also be used in outreach events such as VIMS Marine Science Day. In addition to describing basic wetland hydrology, this video would focus on illustrating the hydrologic connectivity of wetlands to watersheds and downstream ecosystems. Other topics that I may cover include describing how hydrology influences the capacity of wetlands to perform ecosystem functions, and demonstrating how temperature and precipitation alter watershed/wetland hydrology.

Product proposal – blog to the wide science community

Greenhouse gas (GHG) emissions are the primary cause of global warming. Nitrous oxide (N2O) is a powerful greenhouse gas, 300 times more effective as carbon dioxide (CO2) trapping heat. Although CO2 emissions from burning fossil fuels is the largest component of GHG emissions, N2O contributes substantially to global warming. N2O is also responsible for stratospheric ozone depletion and is projected to remain the dominant ozone-depleting substance of the 21st century. Since 1800, the atmospheric concentration of N2O increased by almost 20%. Human activities are responsible for about 30% of total N2O emissions to the atmosphere. Among these activities, soil and livestock manure management make up about 80% of total N2O emissions. If not properly managed, the accumulation of manure and animal waste, e.g. in concentrated animal feeding operations (CAFOs), might drastically increase these emissions. N2O is produced biologically, mostly by certain groups of bacteria and fungi called denitrifiers. These organisms are vital for the sustainability of our biosphere, mostly due to their functions in removing excess nutrients from waterways. However, while performing these important ecosystem functions they also produce N2O. Different amounts of N2O will be produced depending on the specific microbes that predominate in the environment. Changes in the microbial community composition will significantly affect N2O emissions to the atmosphere. Understanding the chemical and physical controls of the these changes will help developing potential N2O mitigation strategies. My research aims to understand how chemical drivers alter the microbial communities composition and how does that impact N2O emissions. I’m particularly focused in how these communities respond to the increasing level of antibiotics released by human activities, such as CAFOs. Antibiotics have strong effects in the microbial communities and might lead to increased N2O emissions by bacterial and fungal denitrifiers. At the same time, antimicrobials are potentially reducing the capacity of these organisms to remove excess nutrients from the aquatic environment. I’m working to determine and quantify these effects using novel genetic approaches combined with rate measurements of these ecological processes.

One potential stakeholder to my research is a nature conservation agency, such as the eastern shore Virginia Coast Reserve (VCR) from The Nature Conservancy network. These agencies work to protect the sustainability and resilience of the ecosystems that they monitor. Some ecosystems are more susceptible to the problems I mentioned, related to the impacts of human activities in the microbial communities responsible for nutrient cycling and greenhouse gas emissions. The VA eastern shore, for example, is home of two major CAFOs and many poultry farms. High manure production, relatively small land area, and proximity to water makes the VA eastern shore prone to contamination with waste and antibiotics. This is potentially affecting the microbial communities responsible for nutrient cycling and greenhouse gas emissions. Knowing how antibiotics act on bacterial and fungal denitrifiers will help conservation agencies predicting how human activities might impact the sustainability of vital ecosystem processes. Other potential stakeholders would be environmental journalists, the general scientific community, federal or state agencies such as the VA Department of Environmental Quality (DEQ), and agricultural managers, such as USDA.

I plan to develop a blog directed to the general public and the wide science community. This blog will contribute to a more educated general audience. It will also be resource to an increasing group of professionals and individuals that seeks reliable and sound information on how human activities impact the sustainability of planet earth. The topics covered by these blog will range from microbial ecology, greenhouse gas emissions, livestock and poultry industry, to environmental toxicology. This blog will contain a variety of materials and resources such as:

  • commentaries to recently published scientific literature. In this section of the blog I will publish my commentaries to technical literature and regularly invite one fellow researcher to write his/her commentary.
  • disclose and highlight publicly available reports on the topics covered. Specifically, documents from federal or international agencies such as USDA, EPA, WHO that report on human activities, greenhouse gas emissions and antibiotics in the environment.
  • suggest books on the covered topics directed to a general educated audience.
  • besides revealing some results from my own research I plan to have sections about my research activity, such as “postcards from the field” or “postcards from the lab” with pictures from the field and the lab respectively.

All these materials will potentially raise awareness on the general public and facilitate scientific conversation among different scientific disciplines.