Product Proposal: “What the heck is a Polychlorinated Biphenyls?!”

Overview

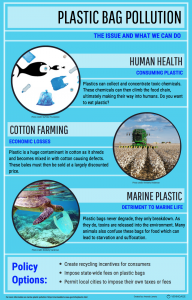
A crucial contributor to the James River’s infirmity is a group of fire-resistant, fat-loving chemicals known as polychlorinated biphenyls (PCBs). Mixtures of PCBs were widely used in commercial and industrial settings. But their production was banned in the late 1970s in the United States because they are a human health hazard. However, PCBs are persistent and are found in sediment, water, and organisms. Larger organisms exposed to PCBs, like fish and us, accumulate more PCB over their lifetime and human consumption of fish is dangerous even at low concentrations (parts per billion).

As a fellow with the Virginia Department of Environmental Quality (DEQ), I am assisting DEQ through its Total Maximum Daily Load (TMDL) program to tackle the problem. The weathering of PCBs and inadvertent present-day production can severely limit TMDL development process because the sources of PCB to the environment are not obvious. My research focuses on using statistical analyses to “fingerprint” PCBs mixtures and find their likely sources.

Reducing PCBs in the environment requires not only identifying what the sources are, but public buy-in. PCBs are not recognized as a present-day hazard by the public. And unless people read all the signage at public access points or look for fish consumption advisories online, there is little to tell them how widespread and current the problem is in Virginia.

Audience

My intended audience is geared to the general public living in the James River watershed. More specifically, the general public includes students, non-profit organizations, community groups, and citizen monitoring groups. A good example of this group is the Middle James Roundtable. During the TMDL process, the interest of the general public are not represented as well or as consistently as industrial, commercial, and municipal interests. Audiences will also be reached by posting it to DEQ’s social media accounts (and perhaps the social media of other state agencies), contacting community groups and asking them to forward/embed videos in newsletters and blog posts, and web-based journal articles (e.g. Chesapeake Bay Journal, Richmond Times-Dispatch).

Proposed Product

I’ve attached a presentation I gave to the Middle James Roundtable on October 23 as a storyboard of sorts. The roundtable was a good test audience because there were a variety of stakeholders, from state agencies to citizens to municipalities. It went very well and I have contacted the roundtable’s steering committee for feedback to better focus my product. From the individuals I was able to talk to while at the conference, two common threads were apparent: “I did not know they were still entering the environment today,” and “Where else are they found?”

While the focus is on reaching those people that live in the James River watershed, I want to create an evergreen product that DEQ can use to educate parties on what PCBs are, how PCBs are addressed, and what the public can do to help. Because PCBs are a chemical compound for which most people do not have a mental image for and because there are many unfamiliar terms and concepts, I would like to create an animated video (around 5 minutes in length) to illustrate a brief history of PCBs and their uses, how and why they are dangerous, and how we can alleviate the issue from both a governmental perspective and individual perspective. By making a video, the information will be more quickly disseminated (what is shared more on social media, infographics or videos?) and can easily be embedded in e-newsletters and website posts by organizations and individuals.

 

PCB_MJRT Presentation

Product Proposal: “Data Collection Guide for Coastal Areas”

Overview

Coastal areas, ranging from densely populated cities to sandy beaches and tidal marshes, are valued spaces for many human, ecological, and environmental reasons alike. This creates high demand over a relatively small area where water meets land in an exciting, always-changing location. Along with the variety of uses, coastal areas are susceptible to damaging storms carrying strong winds, waves, and storm surges (increased water level). Coastal managers need high resolution maps of coastal areas to understand what assets are in these coastal areas, how they change during normal environmental conditions, storm conditions, and climate change. This enables the best management and policy decisions for all users of the coastal environment.

Unfortunately, high-resolution mapping for vegetation, infrastructure, beaches, and nearshore water depths traditionally required costly equipment such as airborne laser and survey vessels that are difficult to deploy rapidly due to size and personnel needed to operate the equipment. Improvements in instrument technology enables local managers, contractors, researchers, and monitors to map their sites with reliable, low-cost, high-resolution data. Consumer level drones map subaerial portions of the coast such as marsh, infrastructure (homes, jetties, seawalls, etc.), and beach surfaces through two-dimensional imagery which is stitched together into three-dimensional (latitude, longitude, elevation) maps using photogrammetry software. Bathymetric (water depth) data can be collected in shallow water using plastic or fiberglass remote-controlled vessels equipped with sonar systems to create two-dimensional sidescan sonar or three-dimensional bathymetry data. Sidescan sonar is useful in mapping benthic habitats such as oyster reefs and sediment type while bathymetric enables seafloor surface detection and sediment movement mapping.

Coastal data with sub-meter accuracy was traditional only available from survey companies with suites of sonar systems and survey vessels or through government agencies with airborne laser systems. Improved technology coupled with lower equipment and data processing costs has put high-resolution survey data into the hands of local municipalities. These groups would benefit from a single document demonstrating pros and cons for different platforms so they can make the most appropriate platform choice for their needs and resources using the experience of another user of these platforms rather than manufacturing stats alone which can be biased towards optimal performance by creator companies.

Audience

I wish to reach those pounding the ground, getting muddy, and collecting data or managing field operation teams. This would include groups in private contracting, governmental agencies, risk assessors, researchers, resiliency planners, and more.

Proposed Project

Coastal projects tend towards unique results with little overlap between sites. Thus the aim of this product is providing applicable methodologies and information for any coastal area around the world, not simply my study sites in Delaware. I envision a “Data Collection Guide for Coastal Areas” that encompasses my personal experiences in the field collecting data in marshes, beaches, and nearshore environments using a variety of instrumentation as well as my knowledge processing the data into usable products for monitoring and understanding environmental processes. The engineering community is fond of guidelines and guidebooks laden with graphs, decision trees, and equations; why not a background-friendly guide for managers, contractors, researchers, monitors who are looking to measure and understand their local coastal systems? The format is fluid at the moment but the document will be space and length efficient using images and tables to delineate what platforms are ideal for the type of coastal environment surveyed while incorporating available funds and personnel considerations.


Helpful Literature:

Casella, E., Rovere, A., Pedroncini, A., Stark, C.P., Casella, M., Ferrari, M. and Firpo, M., 2016. Drones as tools for monitoring beach topography changes in the Ligurian Sea (NW Mediterranean). Geo-Marine Letters36(2), pp.151-163.

Dohner, S.M., Trembanis, A.C. and Miller, D.C., 2016. A tale of three storms: Morphologic response of Broadkill Beach, Delaware, following Superstorm Sandy, Hurricane Joaquin, and Winter Storm Jonas. Shore & Beach84(4), p.3.

Drummond, C., Carley, J., Harrison, A., Brown, W. and Roberts, P., 2017. Observations from the design, construction and drone monitoring of a Geotextile sand container (GSC) seawall. Australasian Coasts & Ports 2017: Working with Nature, p.409.

Giordano, F., Mattei, G., Parente, C., Peluso, F. and Santamaria, R., 2015. Integrating sensors into a marine drone for bathymetric 3D surveys in shallow waters. Sensors16(1), p.41.

Kimball, P., Bailey, J., Das, S., Geyer, R., Harrison, T., Kunz, C., Manganini, K., Mankoff, K., Samuelson, K., Sayre-McCord, T. and Straneo, F., 2014, October. The whoi jetyak: An autonomous surface vehicle for oceanographic research in shallow or dangerous waters. In Autonomous Underwater Vehicles (AUV), 2014 IEEE/OES (pp. 1-7). IEEE.

Turner, I.L., Harley, M.D. and Drummond, C.D., 2016. UAVs for coastal surveying. Coastal Engineering114, pp.19-24.

Westoby, M.J., Brasington, J., Glasser, N.F., Hambrey, M.J. and Reynolds, J.M., 2012. ‘Structure-from-Motion’ photogrammetry: A low-cost, effective tool for geoscience applications. Geomorphology179, pp.300-314.

Project Proposal

Long-term sampling programs are a crucial component of fisheries research. Without long-term sampling programs, proper assessment of fish species and subsequent management would not be possible. Long-term fisheries surveys are a mechanism to obtain data for ecosystem-based fisheries management, assess community structure and diversity, act as a framework to collect research samples, and most importantly, be used as an indicator of relative abundance. We calculate relative abundance by implementing the concept of proportionality; we assume that catch is proportional to abundance in a given area at that time. Trends in relative abundance allow us to interpret patterns of abundance over time, which indicates the effects of over- or unregulated fishing and/or response of the population to management regulations.

I plan to create an infographic geared towards adult members of the public that can be shared formally and informally via social media and the internet. This infographic will start by posing the question, “How do scientists count fish?” This will act as a way to get the viewer to think differently about methods we use in fisheries science. I will then demonstrate a theoretical, standardized fishing set at two separate locations. The location with a high abundance will yield a high catch; the other with low abundance will yield low catch. This will demonstrate how we use proportionality to assess trends in relative abundance. After demonstrating how we calculate relative abundance, I will include explanations for how relative abundance is used with other sources of data (commercial & recreational catches, length distributions, etc.) in integrated stock assessment models to estimate actual fish abundance. I will also include explanations as to why we can’t use commercial fishing (fishery-dependent) data (i.e., fishers are too smart, and don’t waste resources sampling at scientifically designed locations if these sites will not yield a high catch; this significantly affects inferences of relative abundance).

This infographic can be specialized to accommodate different fishing gears (i.e., longline, trawl, gillnet) and different species (i.e., sharks, bottom fishes, sturgeon). Each specialized infographic can have an additional section including a graph of relative abundance of a species of interest over time, and how that trend can be interpreted with respect to key management actions, etc. For example, in the shark longline infographic, I can present results from my master’s thesis findings, and in the bottom fishes trawl example I can highlight work conducted by my research group at VIMS (Multispecies Research Group; MRG).

A (Brief) Guide to Navigating the Shoreline Permitting Process

Below is a proposal for my outreach product for the 2017 Advanced Science Communication Seminar. In brief, my goal is to design a visual aid for coastal landowners to guide them through the shoreline permitting process in the state of Virginia.

The product could then be distributed by my host office (Virginia Department of Conservation and Recreation’s Shoreline Erosion Advisory Service) during site visits to give coastal landowners an overview of the process from start (recognition of erosion problem) to finish (properly installed shoreline management structure).

Proposal:

Outreach_Proposal_Pfirrmann-18vee03

Genetic diversity in seagrass final product

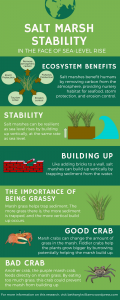
For my final science communication seminar product, I created an infographic on the importance of genetic diversity in seagrass beds. After receiving feedback from my peers and professionals in the field, I decided to change my first draft into a more simple design and message. We also discussed visiting museums to present our products, so I created a small display (described below) that can facilitate conversation with people about the infographic.

Seagrass Genetic Diversity by Gina Digiantonio

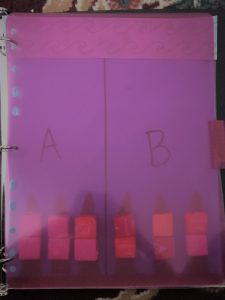
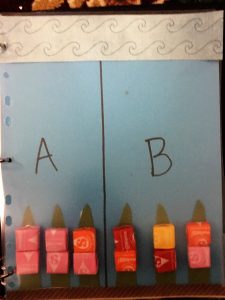
The display is a piece of paper on which two “beds” of seagrass (A and B) are represented with 3 seagrass blades (see picture below). Each seagrass blade has 2 starbursts to represent their genetic diversity. Bed A has two kinds of starbursts present compared to the 4 kinds of starburst in bed B, and is therefore less diverse.

Then, a simulated disease washes over the beds in the form of a pink translucent cover. Suddenly, the pink starbursts are washed out and bed A only has 1 blade remaining while bed B retained its blades.

I will tailor this conversation to different audiences. For example, for a scientifically-minded adult the starbursts can be referred to as “alleles” and we can discuss the influence of dominant vs. recessive traits. My hope is that the activity (and candy) will capture people’s attention, generate interest in the topic, and better visualize the points on my infographic.

Final Product: Fantastic Virginia Corals and Where to Find Them

I am really excited with how the final video turned out! Poor diving conditions prevented me from getting a lot of the extra video that I was hoping for, but I think I made good use of what I have. Taking into account the comments from our last meeting, I tried to create a story that introduces the viewer to a relatively unknown coral species and its importance to the coast of Virginia. It has been uploaded to the Virginia Sea Grant YouTube page, check it out here: https://youtu.be/ICCY8NtFVfk