The Cost of Sick Oysters
ASCS Infographic First Draft
Lauren Huey
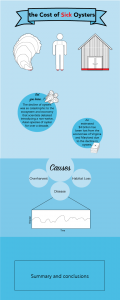
Rough draft of layout:

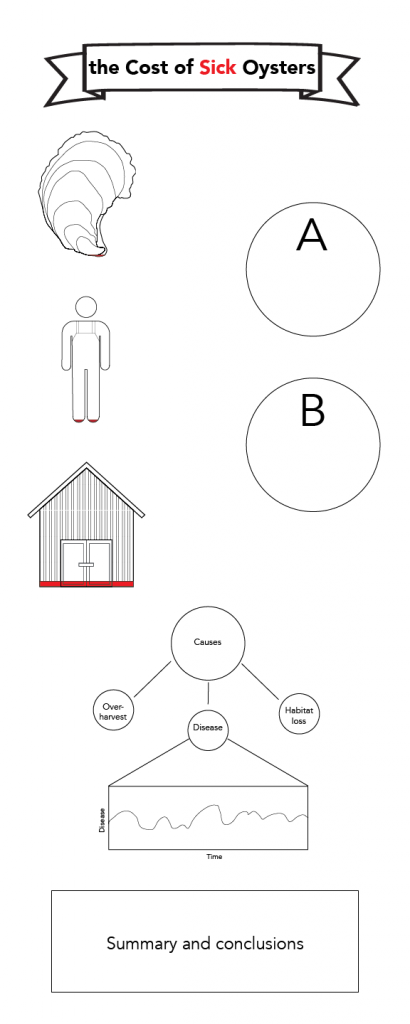
The images that I made of the oyster, the oysterman, and the shucking house represent the change from historical statuses. The full oyster image represents how many bushels of oysters there were in the Chesapeake Bay before their decline with the red portion representing the oysters present in the Bay today, which is about 1% of historical populations (Newell 1988). The oysterman represents the 50,000 oystermen working in the Bay at the peak of harvest in the 1880’s, with the 1000 people with oyster harvest licenses today represented by the red portion (Chesapeake Bay Program 2010). Lastly, the building represents the 136 shucking houses that were in operation in 1974 with the red portion signifying the 6 that were still operating as of 2010 (Chesapeake Bay Program 2010). There will be text to accompany the images but I haven’t written it yet. It will likely be a more concise version of the explanation of the images above. The size of the red portions was calculated based on the percent of the historical status of each factor today, with this percentage applied to the height of the figure and the resulting height being colored red. Through these images, I want to show the effect that the collapse of the oyster fishery had on the local economy and jobs.
A and B are small info bubbles. A will be about the debate on whether or not to introduce a non-native oyster to the Chesapeake Bay that occurred for over a decade. B will state that an estimated $4 billion was lost to Virginia and Maryland’s economy due to the oyster decline (Chesapeake Bay Program 2010).
The bottom portion of the infographic will discuss the causes of decline and bring oyster disease to the forefront. I will include a graph of Perkinsus marinus prevalence over time to show that it is still present at high levels in the Chesapeake Bay. I will end with the light at the end of the tunnel: oysters are recovering, with scientists trying to understand this recovery (which is what I’m doing) so that we can harness the natural resilience of oysters to improve fishery management and restoration efforts.
References:
Chesapeake Bay Program. 2010. On the Brink: Chesapeake’s Native Oysters. Annapolis. https://www.chesapeakebay.net/
Newell, R.I.E. 1988. Ecological changes in Chesapeake Bay: Are they the result of
overharvesting the eastern oyster (Crassostrea virginica). In M.P. Lynch and E.C.
Krome, editors. Understanding the Estuary: Advances in Chesapeake Bay Research.
Solomons, Maryland: Chesapeake Research Consortium Publication 129. CBP/TRS
24/88. pp 536-546.
Updated Layout: