Update to PCB Video and an unexpected project.

My host agency, Virginia Department of Environmental Quality, has posted my video to their YouTube Channel here!

Additionally, I became involved in developing media for DEQ’s 25th anniversary soon after the completion of the seminar. I created story map detailing some of the accomplishments of the agency during its 25-year history.

Final Outreach Documentary: Role of Wetlands in Coastal Resilience


Ali M Rezaie is currently pursuing this multidisciplinary research as part of his PhD in the Civil, Environmental, and Infrastructure Engineering Department at the George Mason University (GMU). For more information, contact at arezaie@gmu.edu.

Special thanks to:

GMU Flood Hazards Research Lab

Virginia Sea Grant 

Resources For the Future 

Potomac Environmental Research and Education Center

All field footage were captured during the field campaign led by the Flood Hazards Research Lab.

Concept, Narration & Direction: Ali Mohammad Rezaie

Videography & Production: Chelsea Gray

Updated Final Product: What are polychlorinated biphenyls (PCBS)?;

I thought I updated my previous post, but I guess not since the changes aren’t on it…


I recorded the voiceover again in iMovie, which was nice and easy  in addition to making a couple changes to images. Here is the video:

I’ve shared it with DEQ and VDH staff, and will reach out to the James River Association, which has said they are interested in using it when working with students (somewhere between 2000-4000 students). DEQ staff can use this for public meetings on PCBs and VDH staff may link to the video on their website.

Outreach Product Final (Second) Draft

Hi all,

Attached is a (mostly) final version of my outreach product, a front-and-back flyer highlighting key steps involved in managing one’s shoreline in Virginia.

Compared to the first draft, I redesigned the flyer visually, removed graphics from the second page, and reduced the amount of text.

See the new second version here:

Pfirrmann VASG SciComm Product Second Draft-1li498y

Final Product – Blue Crab Hide-and-Seek

Following the December meeting, I made changes to my game that made it simpler and closer to my research. I created two models, one of sand and one of seagrass. For the seagrass, I used green ribbon, as this is what my lab uses as artificial seagrass in field and lab experiments. For crabs, I currently have blue marbles, although I am still debating if they are the right size (and if I should draw crabs on them). If I do change materials, I would pick something smaller. My second option is to make a thicker “seagrass” habitat. During the symposium, I’ll use these as models of the different habitats available to juvenile blue crabs. I’m still toying with a few different ideas for the game itself. Below is an in-progress image of the models. There are a few finishing touches left to add, so more pictures to follow.

Semi-final Project: Phase 1

Ciao tutti!

Let’s kick this post off with a confession…this is not a final outreach product but the next step towards a Drone CitiSci collaboration with the USGS’s iCoast. Revisiting the project concerns from the rough draft, all categories were addressed (in my opinion) and potential solutions are discussed here. Karen Morgan is my main point of contact at USGS St. Petersburg, FL along with the web developer for iCoast, Robert Snell. Pre and post storm drone photos from citizens would be a valuable addition to the current database of iCoast, which traditionally is comprised of photos taken from airplanes by USGS scientists. Including citizen drone photos enable greater spatial and temporal coverage of our beaches before and after storms to assess damages and morphology changes rapidly and accurately. Phase 1 of this project was a proof of concept determining if drones could create photos consistent with iCoast imagery and how should citizens then collect these photos. Examples photos are given below from iCoast and my personal drone. They look comparable! USGS currently uses iCoast photos to document coastal storm damages to the beach and surrounding infrastructure. Future work involves measuring features such as the shoreline, berm, dune toe, and dune crest for use in risk probability models by USGS.

Drone Imagery Collection Guideline:

  1. Determine if wind conditions are safe when flying before and after storms
  2. Make sure all people and animals are at a safe distance
  3. Before flying, enable the following parameters

Choose one camera exposure setting and keep it for all images

Angle camera such that the shoreline, beach, dunes, and infrastructure (if any) are visible

  1. Launch drone
  2. Fly drone 50 to 60 meters from the shoreline
  3. Use manual or automated flight controls to fly the drone along the shoreline

Set speed to 4.0 m/s and camera to timed photos every 5 seconds

  1. Fly as much of the coast as you like!

**Screenshots of  instructions coming soon**

Examples:

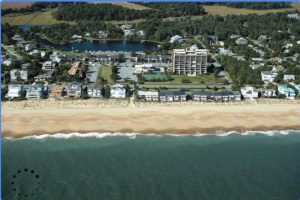
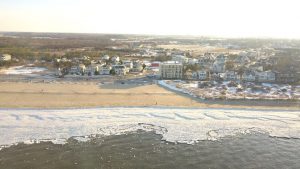
Top figure is from USGS iCoast and the bottom figure was taken by me using a DJI Mavic Pro

Photos Submission Process:

  1. Create an account on iCoast using a Google email (https://coastal.er.usgs.gov/icoast/)
  2. Submit photos after logging into account via the Submission box (to be created)

**Keep all exif (properties info) in photos**

  1. Photos will be quality checked then uploaded to iCoast for classification by fellow citizens!

Launch Events and Recognition:

To get the word out about this project, events will be held during VIMS’ Science Day and UD’s Coast day once the webpage is updated to accommodate this project. Special interest groups such as school STEM classes/clubs, retired and current pilots, Boys and Girls Clubs, Boy/Girl Scouts, and Citizen Science webpages/groups and USGS contacts will be approached for involvement. I foresee this being a mix of personal visits, skype meetings, and electronic advertisements.

Further down the road, I’d like to give recognition to citizens who submit their first photos. Perhaps a button, pin, or badge such as the Horseshoe Crab counting system employed in Delaware. Then, as more photos are submitted, that user is given recognition on the iCoast home page for the number of cumulative photos they’ve sent.

American eels: Return of the Natives

Attached is the most recent draft of my infographic (02/06/18):

JStudio_ASCS_Draft3

I took into account all of the format and language advice from our last meeting. Any guidance on how to make it more visually appealing at first glance would be very beneficial. I also plan to have the first blog post written, and available on the website/URL contained in the infographic, in time for the symposium.

What are polychlorinated biphenyls? (Final product, whiteboard animation)

Here is a link to my whiteboard animation video:

After the December meeting, I reduced the script to a single page. The video is just over 3 minutes. The voiceover needs to be redone as there are 2 obvious pauses that make it awkward. Videoscribe’s voiceover tool has the user do it in 1 take. However, I realized I can export the video to iMovie sans voiceover and then record the voiceover in as many takes as I need. So, I am going to redo the voiceover this week and repost the video to Youtube. But for now, enjoy!

Outreach Product First Draft – Shoreline Protection Quick Guide

Attached is the first draft of my outreach product, a front-and-back flyer for coastal property owners about the shoreline protection and permitting process in the Commonwealth of Virginia.

The front page highlights key steps and major components of the process, from identifying potential shoreline management options to implementing the project. It will also include contact info (phone numbers, and in an electronic pdf version, hyperlinks) for additional resources.

The back features two diagrams. One depicts the various agencies and regulations that protect different physical elements of the shoreline, and the other illustrates the steps of the permit review process.

I anticipate substantial edits and changes over the next few weeks as I prepare my final draft. These include:

  • I have yet to receive feedback from stakeholders, and plan to make changes upon receiving their comments suggestions.
  • I plan to adjust font, colors, images, and general aesthetics moving forward once I consult with those with more design experience
  • The two diagrams on the backside are from existing products created by Fairfax County and the Virginia Institute of Marine Science. I plan to either edit or recreate them for the final draft so as to better fit with the general theme/aesthetics.

The draft can be downloaded here.

Outreach Project Draft Part 1

Storyboard for Stable Isotope White Board Video

A short video explaining how scientists use stable isotopes to study nutrient pollution. This will be done as a white board video. Below is the storyboard and proposed script for the video.

  1. Marine scientists study a wide range of organisms and processes in coastal estuaries. Some study fish (point to fish), others study macrofauna like sea grass (point to seagrass).

  1. And some study plankton that you can barely see (zoom to zoo- and phytoplankton).

  1. Marine chemists study chemical compounds in the water and inside the organisms living in the estuaries. Nutrients are a specific group of chemicals that phytoplankton use as food. This food can come from a wide range of places.

  1. They can come from their neighbors (chomp!).

  1. They can come from the local wastewater treatment facility (wastewater outflow), and they can come from the fields that the you and I get our food from (field with rain storm flowing water into river).

  1. Scientists are curious about know where the food for all the hungry phytoplankton come from and which ones they like to eat (Happy/sad phytoplankton).

  1. To figure it out some marine scientist use stable isotopes. Most elements have a set number of protons and neutrons. Each molecule of nitrogen has 7 neutrons and 7 protons, this is nitrogen 14… but almost 0.4% of all nitrogen molecules have an extra neutron, nitrogen 15.

  1. Scientists can track where the phytoplankton’s food comes from based on how much 14N and 15N is inside it.

  1. The fertilizer from the field has more of one type and the wastewater has more of another.

  1. When we look at the phytoplankton we can see a mixture that can tells us where the food is coming from.

Repeat panel #8

  1. This is important because many waterways are undergoing a process of eutrophication, which often happens when there is too much food for phytoplankton.

  1. This causes phytoplankton rapidly grow, which can cause problems for other organisms living in the water (dead fish).

  1. Using isotopes, we can figure out where that extra food is coming from so that managers know how to best take care of the bay.

Drone CitiSci Project: Very VERY Rough Draft

Below is an outline type of table which I hope conveys my current mindset with respect to the drone citizen science project. My aim is to collaborate with the United States Geological Survey (USGS) by adding coastal images captured by recreational drone users before and after storms (potentially on a regular basis) to add to their existing iCoast CitiSci project. This open-source (html coded) internet project has been running for two years and encompasses the Mid-Atlantic states’ ocean coasts following several major storms such as Hurricanes Sandy and Joaquin. USGS Scientists captures oblique aerial images of the coast from a small plane before and after storms. Once images are uploaded to the website (https://coastal.er.usgs.gov/icoast/index.php), volunteer citizens login to categorize changes between the before and after images. These thousands of observations made by the citizens go into coastal morphological probability models to calculate the vulnerability of the photographed coastlines in the event of future storms.

I see a huge potential to increase both the spatial and temporal sampling of their image catch without additional funds and effort from USGS. I’ve never traveled to a place where someone isn’t fly a drone and taking photos or videos. There’s a huge opportunity to mine coastal images from recreational drone users while they enjoy flying their drones, taking great images, and improving their coasts’ resiliency to storm events. These are my thoughts as to what needs to be done for this project to proceed. Please let me know what you think!

Point/Task

Action

Questions and Issues

Collaborate with USGS

Make contact with manager of iCoast to discuss adding to the project My role in the altering of this project and if more funding is needed.

Example drone photos

Take images to demonstrate feasibility of drone images in the iCoast data collection method Will it be able to replicate the original plane images and provided the needed scientific data?

Method for adding drone photos

Determine if source code is currently compatible with drone images and metadata How is the photo metadata used by USGS? (Lat, Lon, altitude, camera parameters)

CitiSci photo collection guide

Create instructional video (drone perspective? Drone recording drone?) or ppt or instructional steps for volunteers What is the importance of the camera parameters such as resolution (MP) and focal length? Citi takes FAA responsibility for actions.

Submission of photos to USGS

Decide if link on iCoast webpage/login portal or email to contact for incorporation Identity concerns, amount of data anticipated, prioritize specific areas first?

Advertisement/Involvement

Get the word out and potential create workshops around the area to promote this and iCoast Webinar more effective?? Rather than traveling all the time, USGS has a broad audience to appeal to for this.


Outreach Product Proposal

Nutrients help fuel marine primary production and urea is an important dissolved organic nitrogen source. The understanding how urea cycles in estuarine environments is the underlying concept of my research. In the marine environment, urea originates from a mixture of natural and anthropogenic sources. Natural sources include bacterial release and excretion from zooplankton or fish, while human-based sources include wastewater effluent, industrial waste, and fertilizer runoff. In recent years, the human input has grown considerably, especially in reference to fertilizer usage. I propose to create both an infographic and a short film that will introduce stakeholders and the general public to urea sources and how it is studied.

The infographic I plan to create will explain the sources of urea and why we care about estuarine urea loading. The infographic will be visual, with cartoon representations of human and natural sources feeding with arrows into a river. The first version will include 2-3 short facts to engage the audience as to why urea sources are important in coastal marine ecosystems. I plan to make this version broad enough to distribute to the public events such as VIMS Marine Science Day, at HRSD, or online. The infographic will be constructed using Adobe Illustrator and InDesign. With this outreach product, I hope to expand public knowledge and awareness of sources of urea in coastal ecosystems beyond just excretion.

An additional version will be created to illustrate the same sources feeding into a chemical diagram of the urea cycle. This version will allow me to present the results of my dissertation work to an academic audience. My dissertation includes analysis of the sources of urea in the York River, VA and this infographic will be useful for scientific presentations.

Isotope tracing is a staple method of my research and is used for both uptake rates and tracing nutrient sources. This is a complex concept that can be difficult to convey to an audience without a chemistry background. The second outreach product I plan to create is a short educational video on isotope tracing. This video will explain how naturally occurring stable isotopes may be utilized to trace sources of compounds based on differences in natural abundances.

The video will give a brief explanation of isotopes and how they can be present in different amounts. I hope to design this video to mirror the aforementioned infographic. Using colors to represent the different isotopes I will use urea sources as an example. I will then show the isotope “colors” being consumed by a phytoplankton. This video will be made as a short (2-minute max) whiteboard animation that will be distributed via social media and uploaded to YouTube.

First Draft: ‘Reconnecting Coastal and Inland Waters of Appalachia’

Attached are the first drafts of the infographic that I proposed. The hard copy is made to be easily printed out on 8.5″ x 11″ paper with minimal colored ink. The electronic copy is a bit more attractive because I do not have to consider the logistics of printing out a large quantity. I have also considered doing a few blog entries addressing eel conservation, which would be provided via QR code on these infographics. I am pondering a few topics I want to address first on the blog and hope to get it up and running soon.

JStudio_ASCS_Draft_Hardcopy-1uiwkgn

First Draft: What the heck is a polychlorinated biphenyl?

The most significant steps I have made with my outreach product are a script (see link below) and that I have begun to develop vector images using Inkscape (see the giant, cute ‘redbreast sunfish’ below). I have accessed a whiteboard animation software, but I am holding off on purchasing the monthly plan until I have a much larger image library to work with.

The basic idea of my video is to introduce people to PCBs (polychlorinated biphenyls), how they are useful, how they are downright awful, and what actions we can take. Noticeably I’ve left out all mentions of ‘TMDL”  and even remediation as I’ve tried to approach in a way that helps you steer clear of PCBs versus how we reduce them in the environment.

The left-hand column is the script that will accompany the images and text (the right-hand column): VASG_ASC_VidOutline_11272017-Kirk